59 · Profile Prefill vs Decode
Source: fanout.sh / inference-eng / 12-05 · ~9 min
NOTE
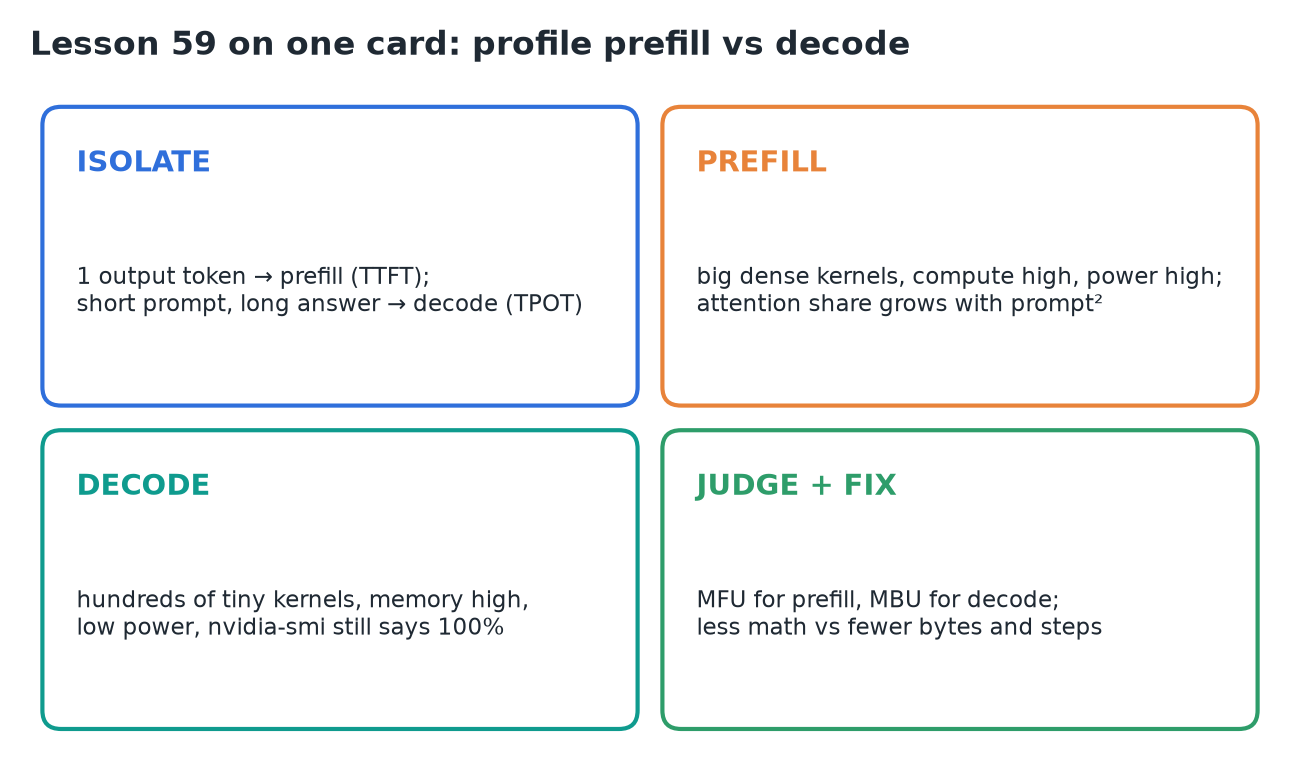
Prefill and decode run the same weights but are two different programs on the GPU. Prefill pushes thousands of tokens through big matrix multiplies and is compute-bound; decode pushes one token per request through hundreds of tiny kernels and is memory-bound. So profile them separately, predict each with napkin math first, judge prefill by MFU and decode by MBU, and pick fixes that match: less math for prefill, fewer bytes and fewer steps for decode.
1. Get two clean profiles
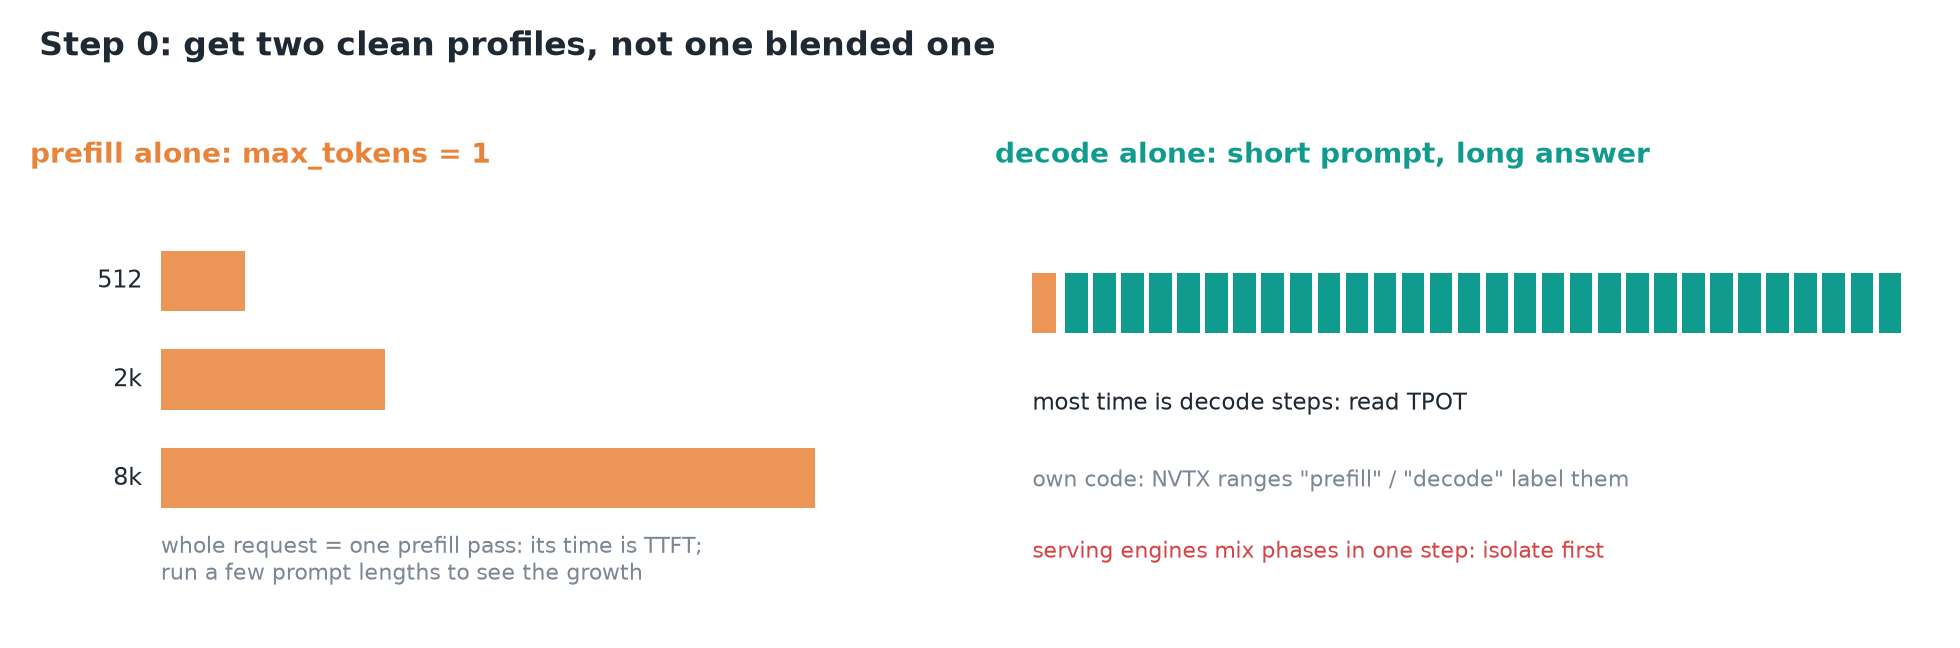 One profile per phase, never a blend.
- Prefill alone: send a prompt with
max_tokens = 1. The whole request is one prefill pass, so its time is TTFT. Repeat at a few prompt lengths to see how it grows. - Decode alone: a short prompt and a long answer, so almost all time is decode steps; read TPOT.
- In your own code, wrap each phase in NVTX ranges ("prefill", "decode") so they show as labeled bands on the Nsight Systems timeline.
- Serving engines mix both phases in one step (chunked prefill, continuous batching), so a production trace blends them. Isolate first, then look at the mix.
2. Napkin math first
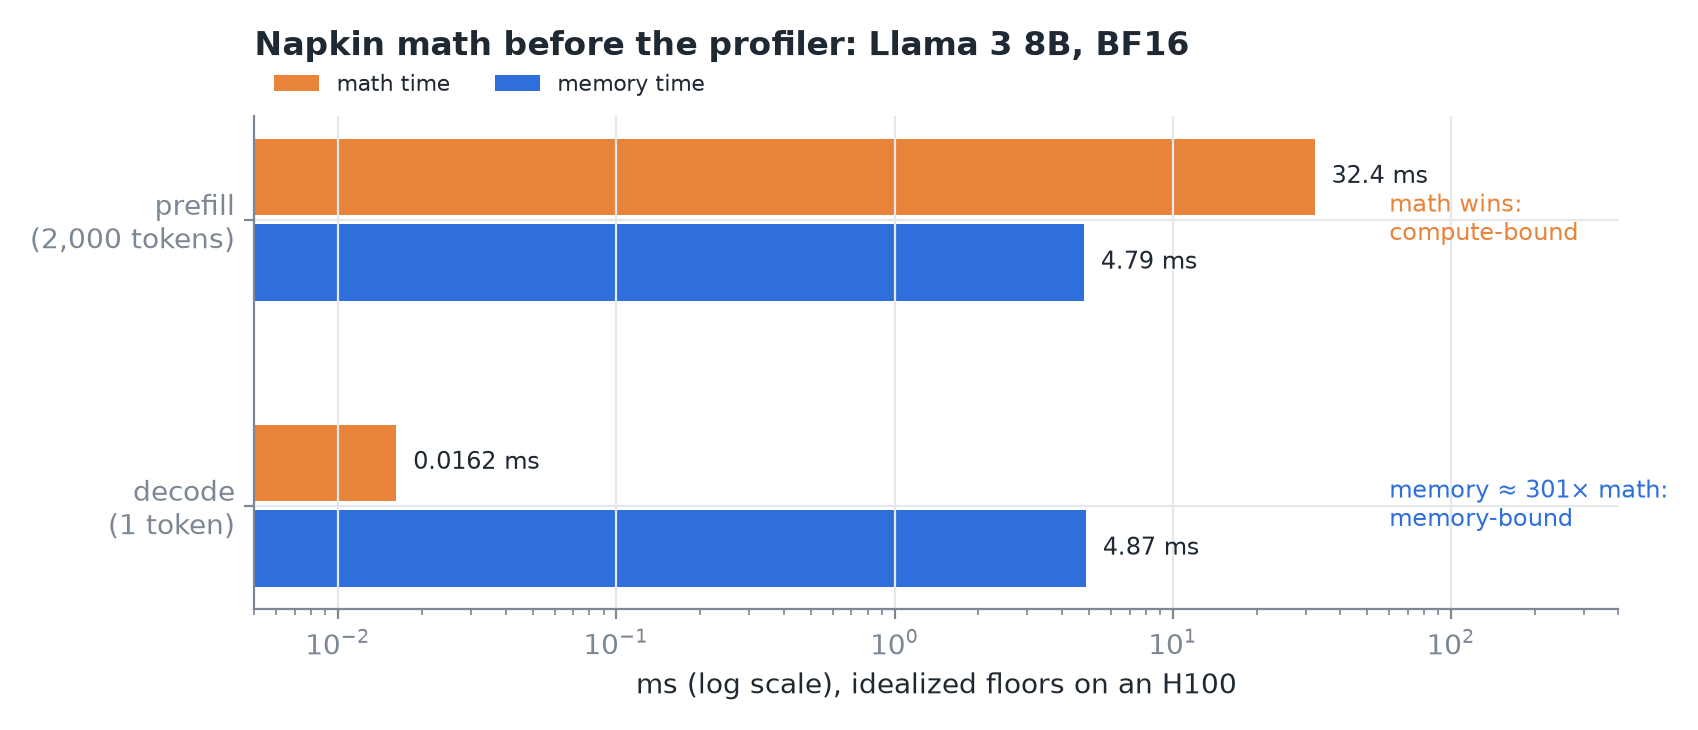 Llama 3 8B in BF16 on an H100 (989 TFLOPS, 3.35 TB/s).
- Prefill reads the weights once and does math for every prompt token: math ≈ 32 ms against < 5 ms of reading. Compute-bound.
- Decode reads all weights plus the cache to produce one token: ≈ 4.9 ms of reading against 0.016 ms of math, ≈ 300×. Memory-bound by hundreds of times.
- The lesson rounds peak to about 1,000 TFLOPS (≈ 33 ms) and decode to ≈ 5 ms. Both check out.
- ◆ The 0.26 GB of KV is a 2,000-token cache at 128 KB per token (32 layers × 8 KV heads × 128 dims × 2 for K and V × 2 bytes).
3. The prefill profile
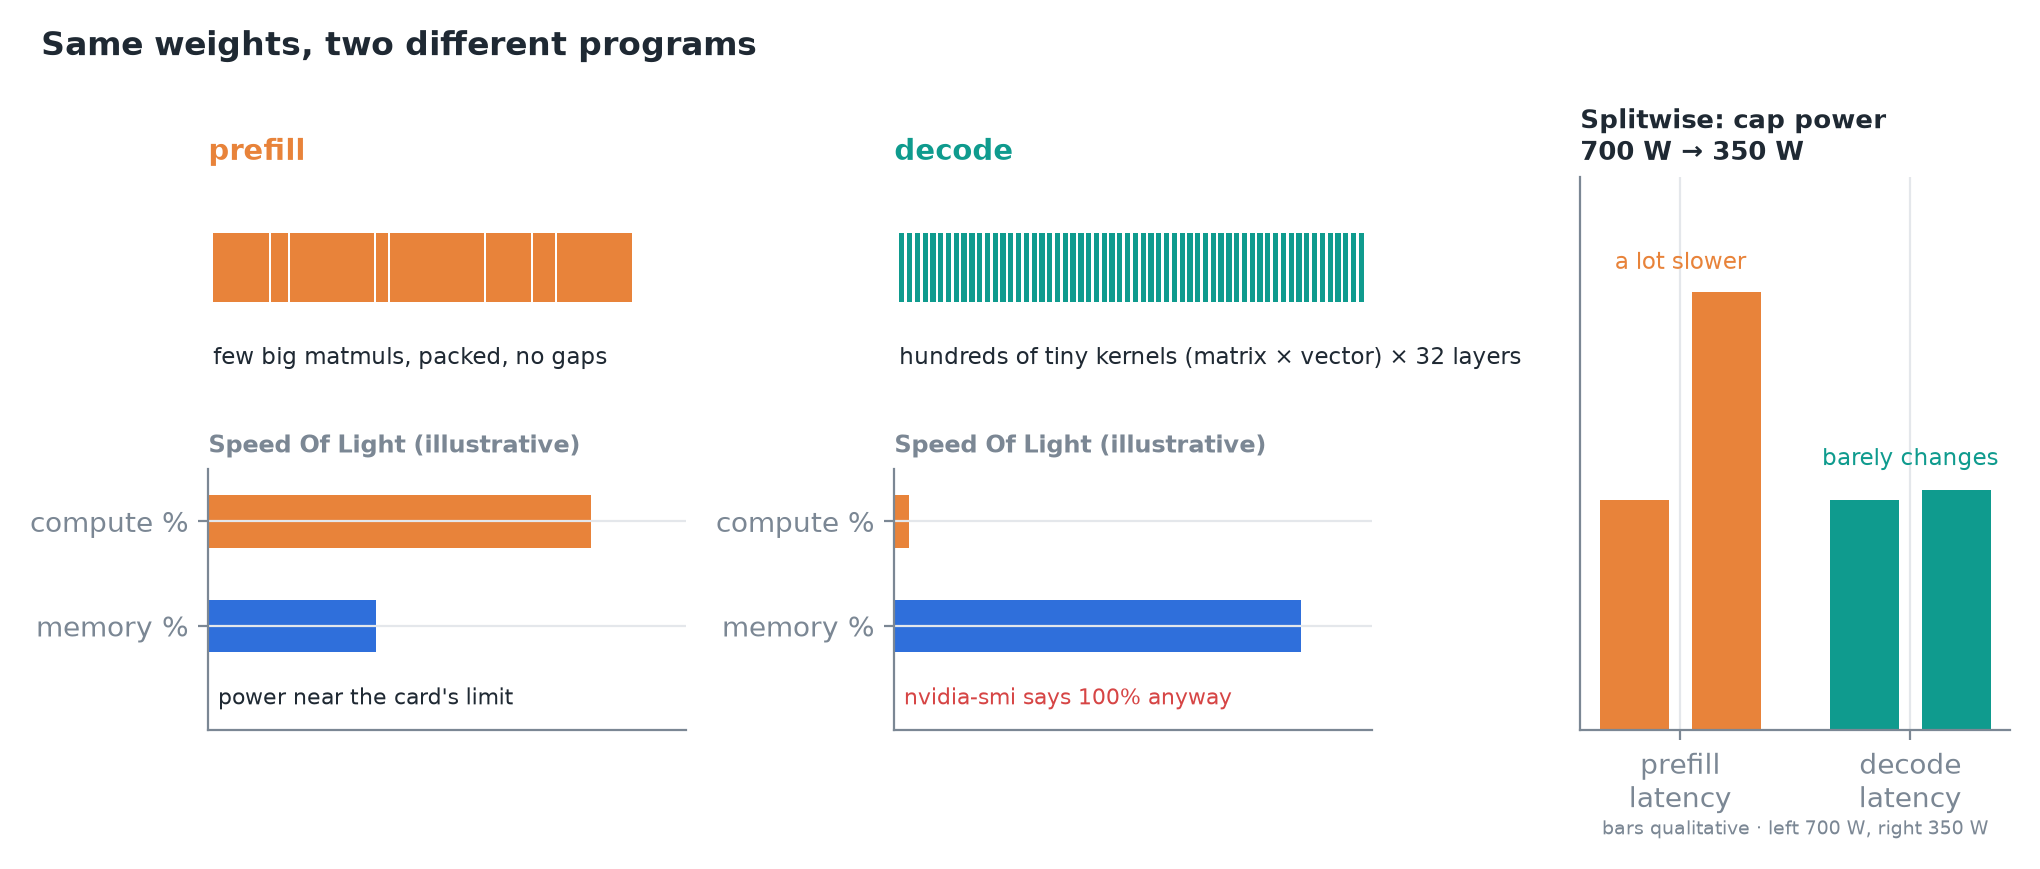 Same model, two traces. Speed Of Light bars are illustrative.
- Timeline: a few big dense matmul kernels, packed back to back, no gaps.
- Nsight Compute Speed Of Light: compute % high, memory % lower.
- Power sits near the card's limit: the tensor cores are actually working.
- Splitwise (power cap from 700 W to 350 W): prefill latency gets a lot slower, decode barely changes. Power-hungry means compute-bound.
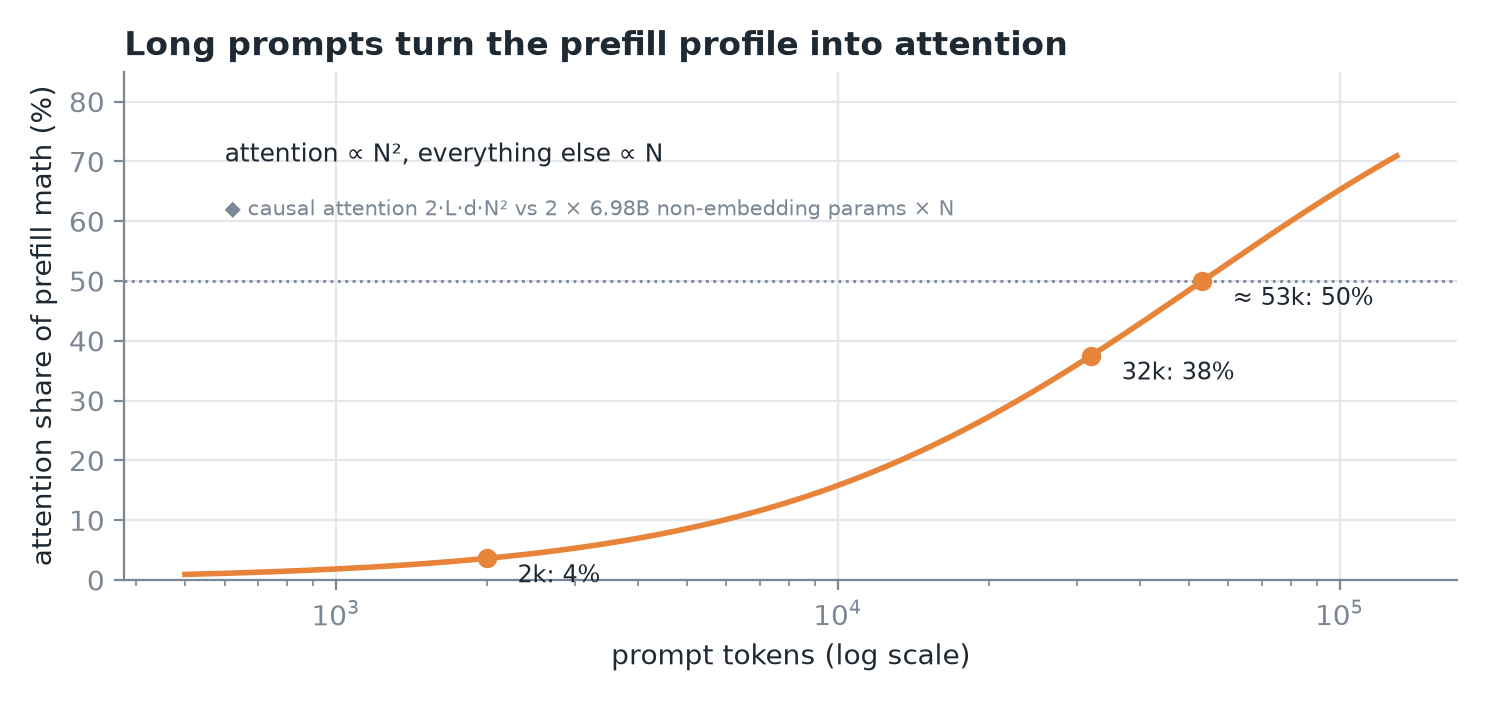 Computed for Llama 3 8B.
- Attention math grows with N², everything else with N. So the profile shifts with prompt length:
- 2k tokens: attention ≈ 4% of prefill math; the profile is matmuls.
- 32k tokens: ≈ 38%.
- ≈ 53k tokens: 50%; attention is half the bill.
- ◆ Checked: causal attention costs 2·L·d·N² FLOPs (QKᵀ and AV, half the matrix), the rest 2 × 6.98B non-embedding parameters × N. That gives 3.6%, 37.5% and a crossover at ≈ 53,250 tokens.
4. The decode profile
- Timeline: hundreds of tiny kernels per step (norm, QKV, RoPE, attention, output projection, norm, MLP, repeated for 32 layers). Each is a matrix times one vector.
- Speed Of Light: memory % high, compute % tiny.
- nvidia-smi says 100% utilization. It only means some kernel was running, not that the tensor cores were busy.
- Without CUDA graphs there are gaps between those small kernels (CPU launch overhead). Engines that capture graphs show one graph launch per step instead.
WARNING
"100% GPU utilization" on a decode workload tells you nothing. Read memory % and MBU instead.
5. Where the wall time goes
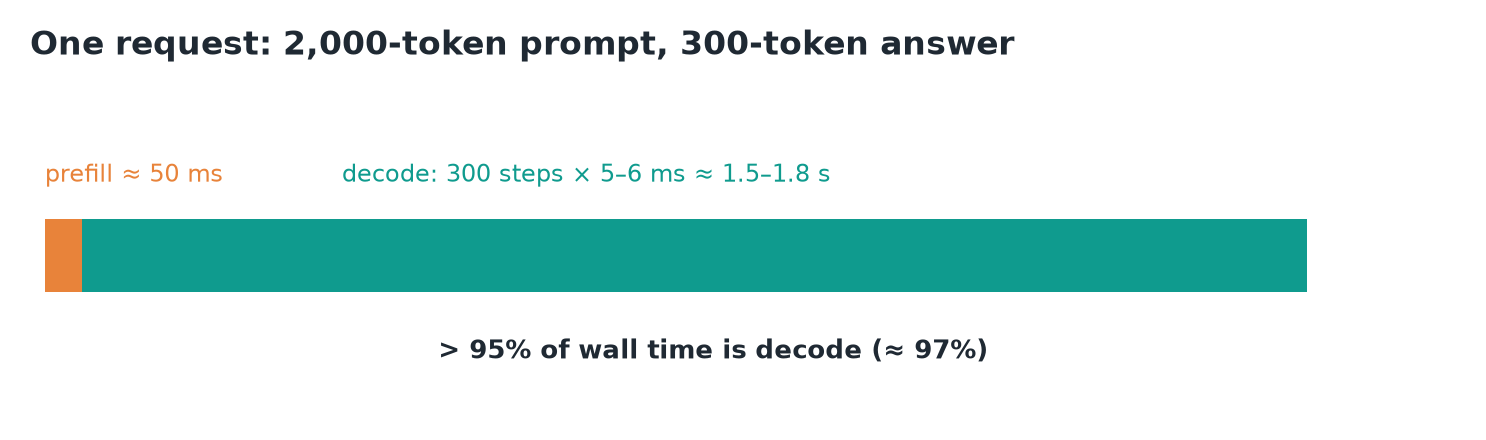 2,000-token prompt, 300-token answer.
- Prefill ≈ 50 ms; decode 300 steps × 5–6 ms ≈ 1.6 s. Decode is > 95% of the request (≈ 97%).
- Splitwise reports the same at fleet scale: most end-to-end time is token generation.
- Prefill still matters: it sets TTFT, and in a mixed step it delays the decodes that share it.
6. Add load
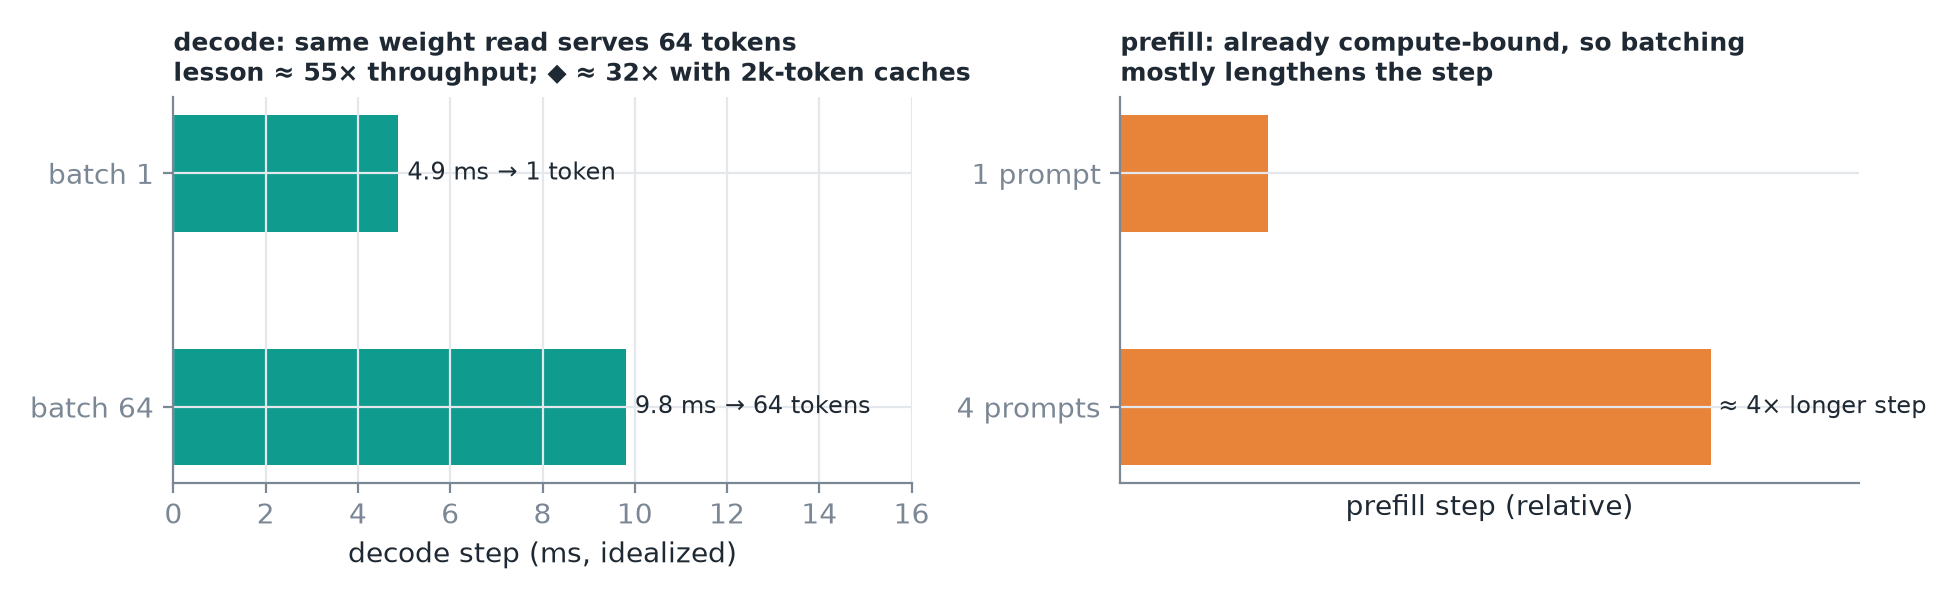 Batching helps the phase that was waiting on memory.
- Decode, batch 1 → 64: the step gets only slightly longer, because the weight read is shared by 64 tokens. Throughput rises ≈ 55× in the lesson's example.
- ◆ How far the gain holds depends on context length: with a 2,000-token cache per request, 64 caches add 16.8 GB, the step goes from ≈ 4.9 to ≈ 9.8 ms and the gain is ≈ 32×. Short contexts get closer to 64×.
- Prefill, 1 → 4 prompts: already compute-bound, so the step gets ≈ 4× longer. Little throughput gain.
7. Judge and fix by phase
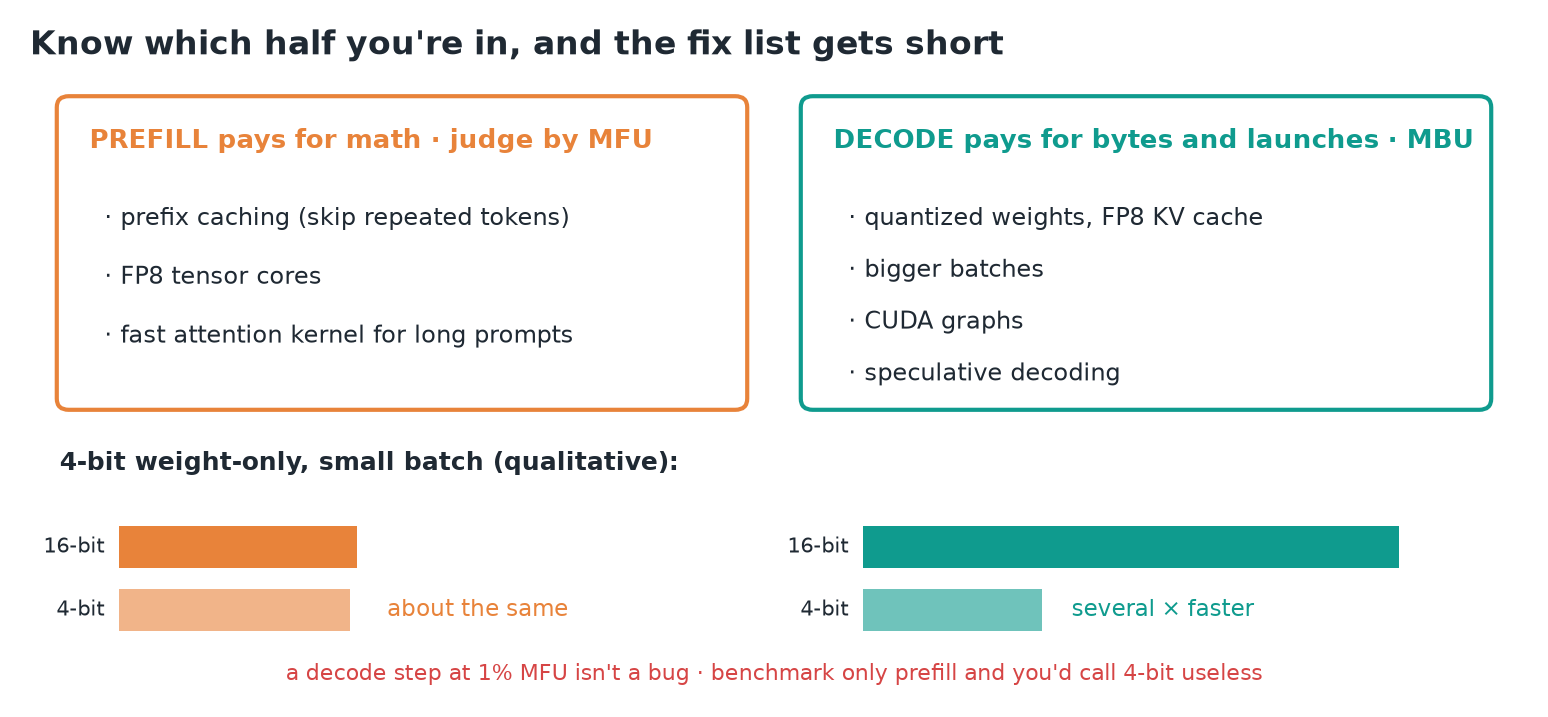 The 4-bit bars are qualitative.
- Yardsticks: MFU for prefill, MBU for decode. A decode step at 1% MFU is normal, not a bug.
- Prefill pays for math:
- prefix caching (skip tokens already computed);
- FP8 tensor cores;
- fast attention kernels for long prompts.
- Decode pays for bytes and launches:
- quantized weights, FP8 KV cache;
- bigger batches;
- CUDA graphs;
- speculative decoding (more tokens per weight read).
- 4-bit weight-only example: prefill stays about the same (it wasn't waiting on bytes); decode gets several times faster. Benchmark only prefill and you'd call 4-bit useless.
IMPORTANT
First ask which phase owns the time, then which resource that phase is bound on. The fix list follows from those two answers.
8. Recap