20 · TTFT, TPOT, ITL, E2E & Throughput
Source: fanout.sh / inference-eng / 04-01 · ~6 min
NOTE
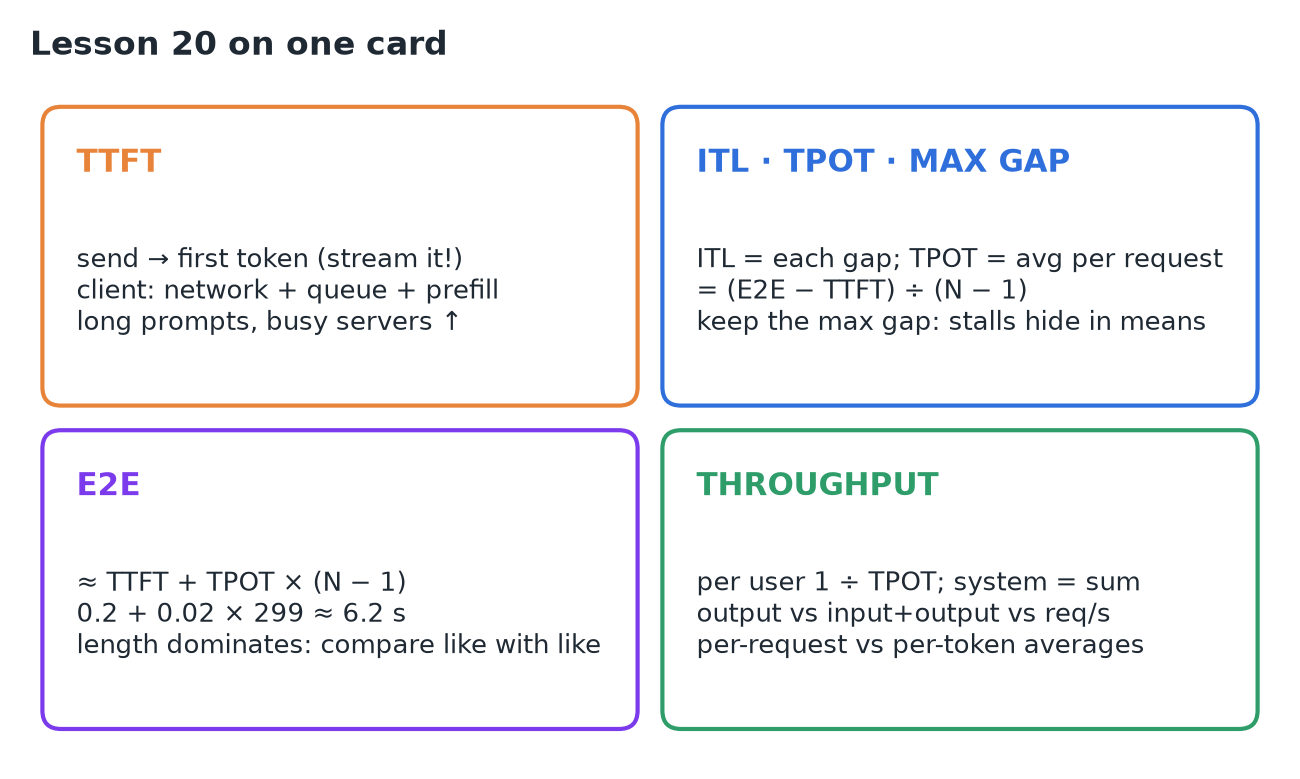
Every serving number measures a piece of one request's timeline. TTFT: send → first token (network + queue + prefill); you must stream to see it. ITL: each gap between tokens. TPOT: one request's average gap = (E2E − TTFT) ÷ (N − 1); 20 ms = 50 tok/s. Keep the largest gap too, because a 500 ms stall barely moves the mean. E2E ≈ TTFT + TPOT × (N − 1): 0.2 + 0.02 × 299 ≈ 6.2 s, dominated by output length. Averaging trap: per request 30 ms vs per token 10.4 ms on the same data. Throughput: per user 1 ÷ TPOT (40 tok/s); system = sum (64 × 40 = 2,560 output tok/s). Check what a headline counts, where the clock starts, and whether you're timing tokens or messages.
1. One request, one timeline
The user presses send, waits, sees the first word, then reads words as they stream in until the answer is done.
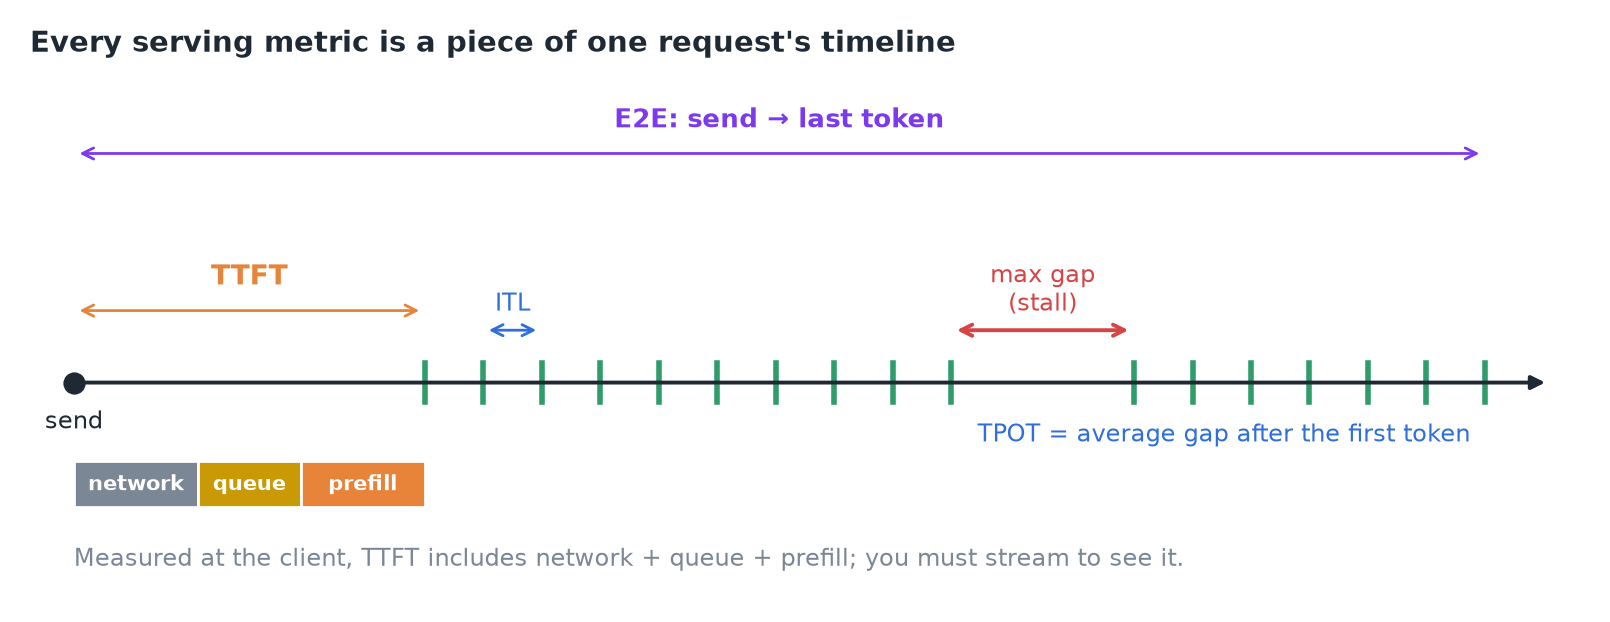 TTFT covers the wait. After it, each gap is an inter-token latency (ITL); their average for the request is TPOT; the largest one is the stall. E2E spans the whole thing.
2. TTFT: the wait
Time to first token runs from sending the request to the first token arriving. Measured at the client it includes network time, time in the server's queue, and prefill of the whole prompt. It decides whether an app feels responsive.
- You must stream to measure it: without streaming, the first token arrives together with the last.
- Long prompts (more prefill) and busy servers (longer queue) both push it up.
3. ITL and TPOT: the pace
Each individual gap between tokens is an inter-token latency. Average them for one request and you get its time per output token:
The first token is left out because its wait is already in TTFT. TPOT sets reading speed: 20 ms per token = 50 tokens/s, faster than anyone reads.
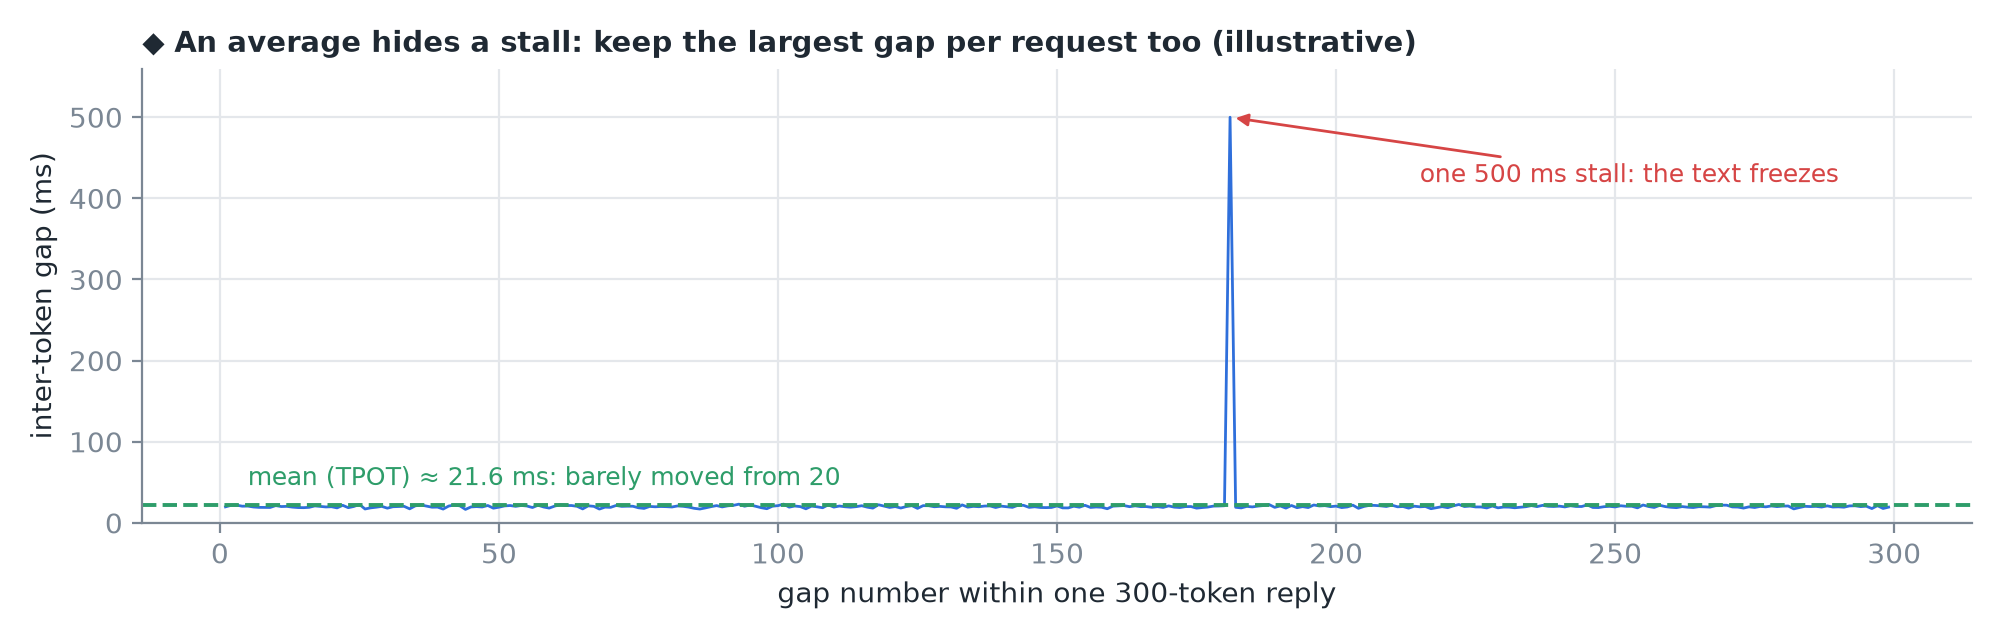 ◆ 298 gaps of 20 ms plus one of 500 ms: the mean moves only to (298 × 20 + 500) ÷ 299 ≈ 21.6 ms, yet the user watched the text freeze for half a second.
IMPORTANT
An average hides stalls. Also keep the largest gap for each request.
4. E2E: the whole request
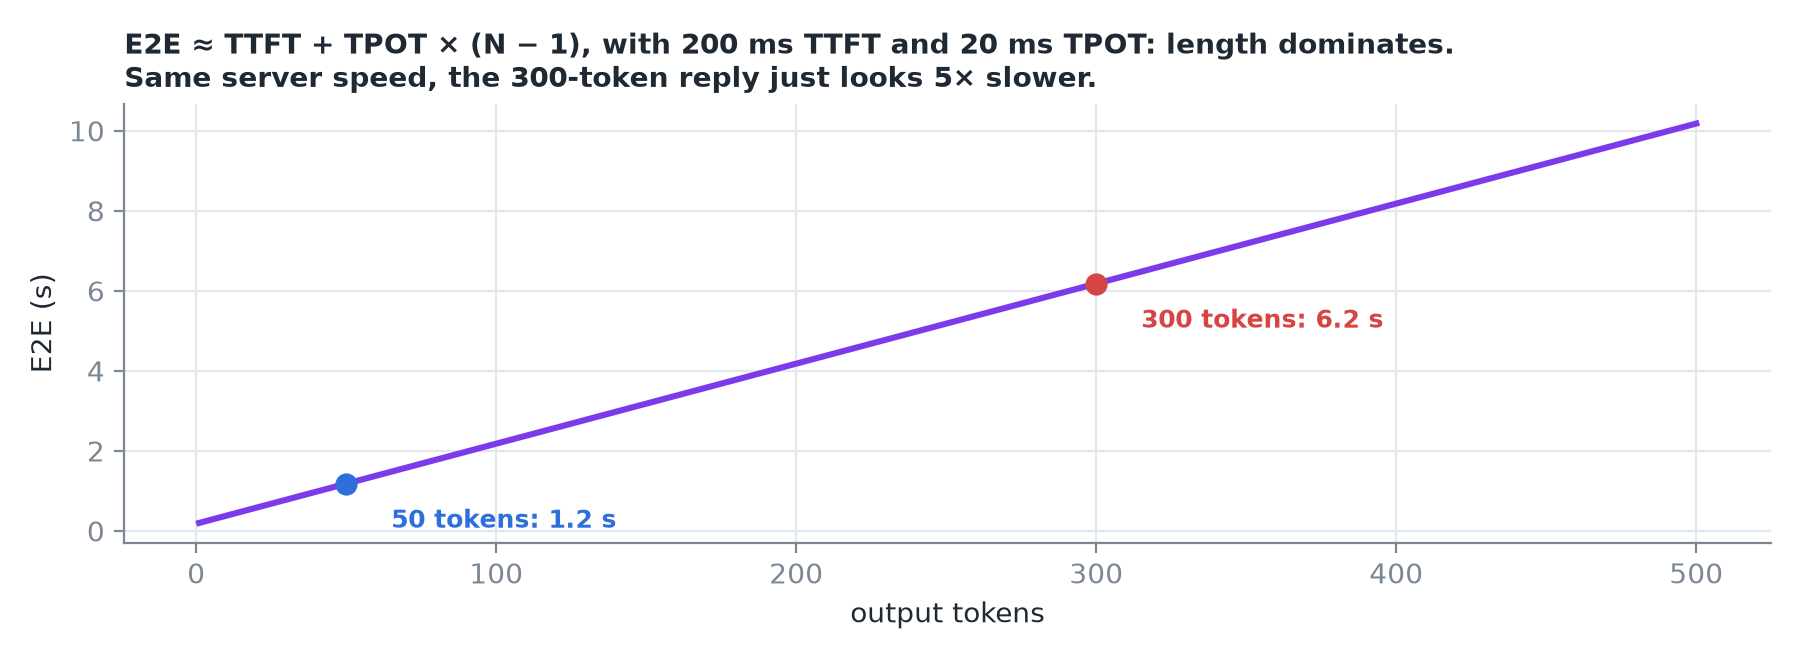 The 200 ms wait is a rounding error next to 299 gaps: answer length dominates.
CAUTION
E2E alone misleads: a "slower" request may just have written a longer reply. Compare E2E only between requests of similar length, or compare TTFT and TPOT instead.
5. The averaging trap
Request A writes 10 tokens at 50 ms gaps; request B writes 1,000 tokens at 10 ms gaps.
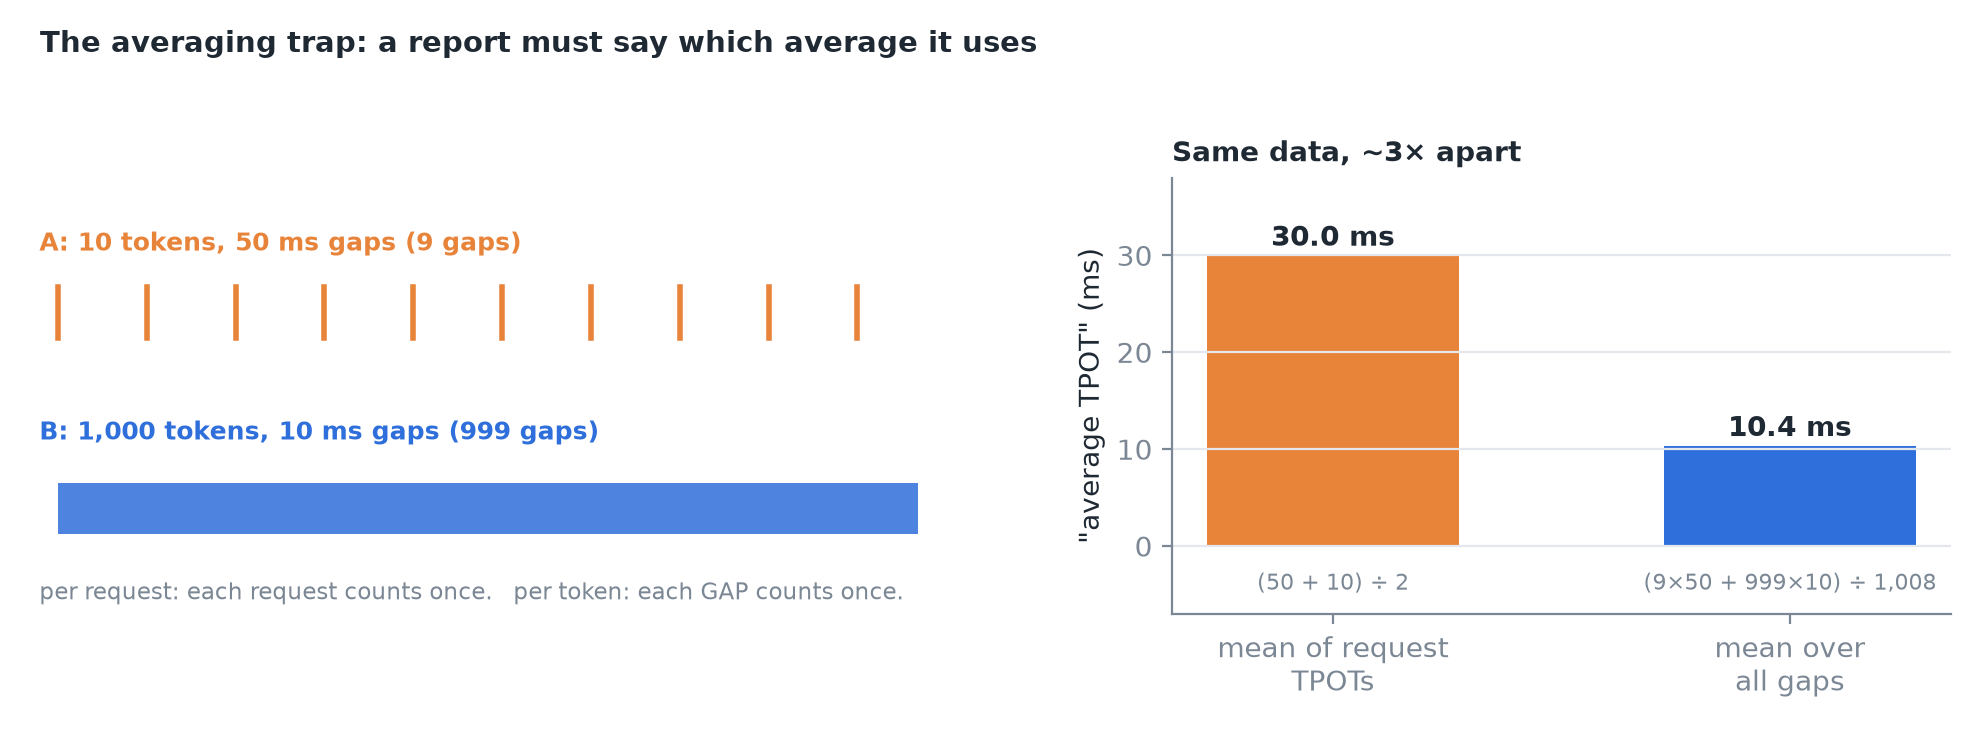 Per request: (50 + 10) ÷ 2 = 30 ms. Per token: B's 999 fast gaps swamp A's 9, giving ≈ 10.4 ms.
Neither is wrong. The first treats every request equally, the second every token. A report must say which one it uses, or two tools will disagree on the same run.
6. Throughput: work per second
- One user: the inverse of TPOT. 25 ms per token → 40 tokens/s.
- The system: add every stream. 64 users × 40 = 2,560 output tokens/s.
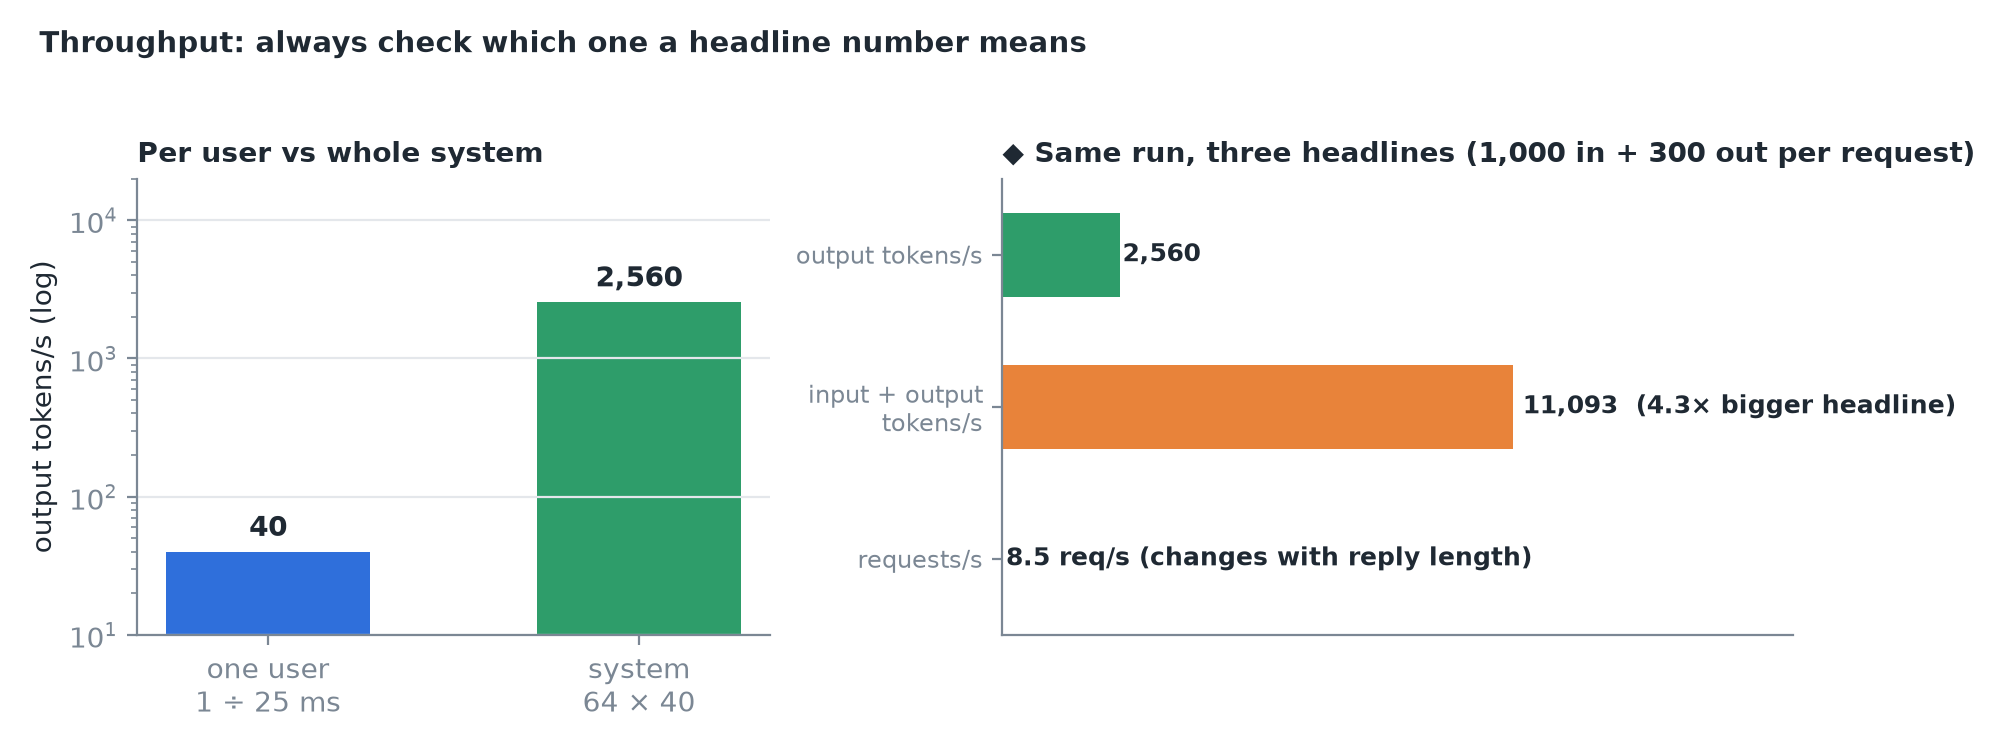 Right: ◆ illustrative 1,000-token prompts. Counting input tokens inflates the headline (prefill chews through prompts very fast); requests/s depends on reply length.
TIP
Always check which throughput a headline means. And the decode trade-off still holds: more concurrent users raise system throughput but make each user's TPOT a little worse.
7. Where the clock starts, and chunking
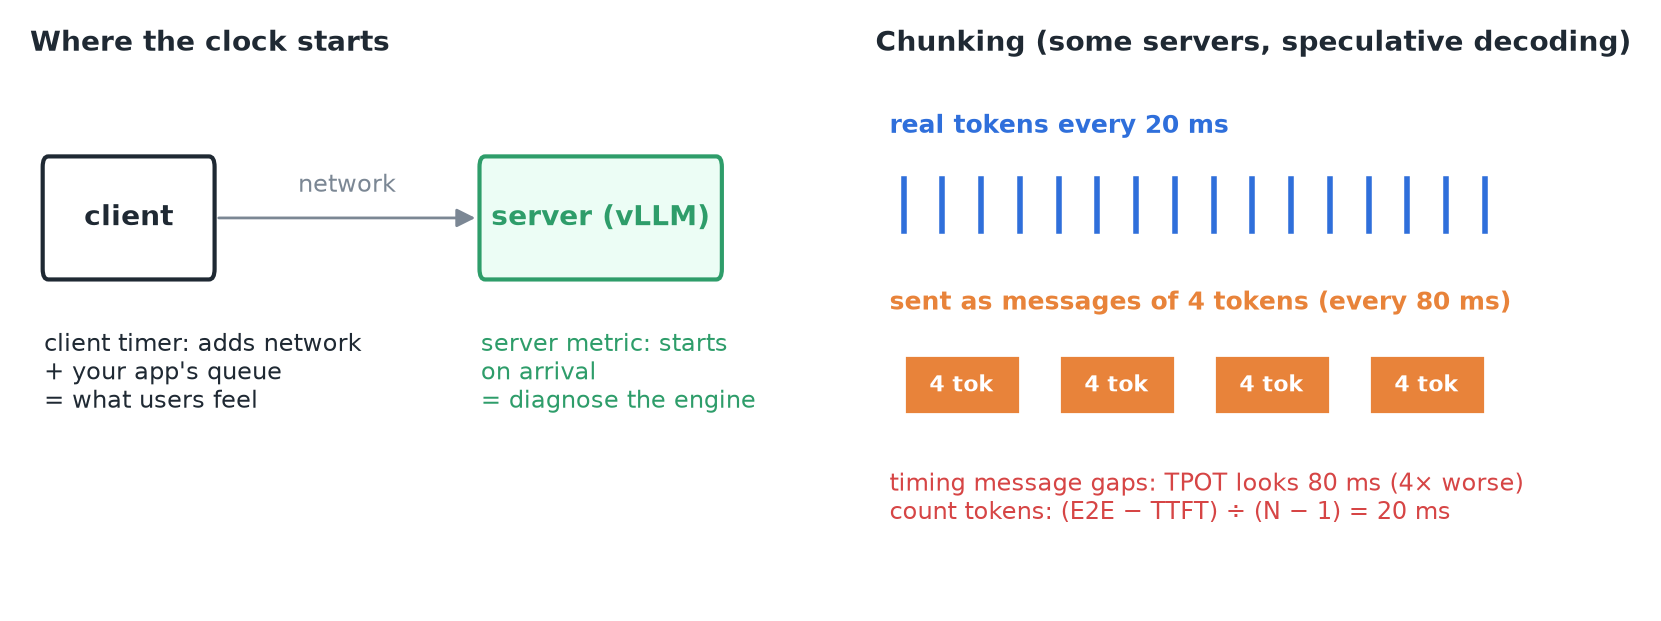
- Client timer: includes the network and any queue inside your own app. Use it to describe what users feel.
- Server metric (e.g. those vLLM exports): starts when the request reaches the server. Use it to diagnose the engine.
- Chunking: some servers, and speculative decoding, send several tokens per network message. Time the message gaps and TPOT looks several times worse (4 tokens per message → 4×). The safe formula counts tokens, not messages: (E2E − TTFT) ÷ (N − 1).
8. Recap