61 · Compute-Bound vs Memory-Bound & the Roofline Model
Source: fanout.sh / inference-eng / 12-07 · ~6 min
NOTE
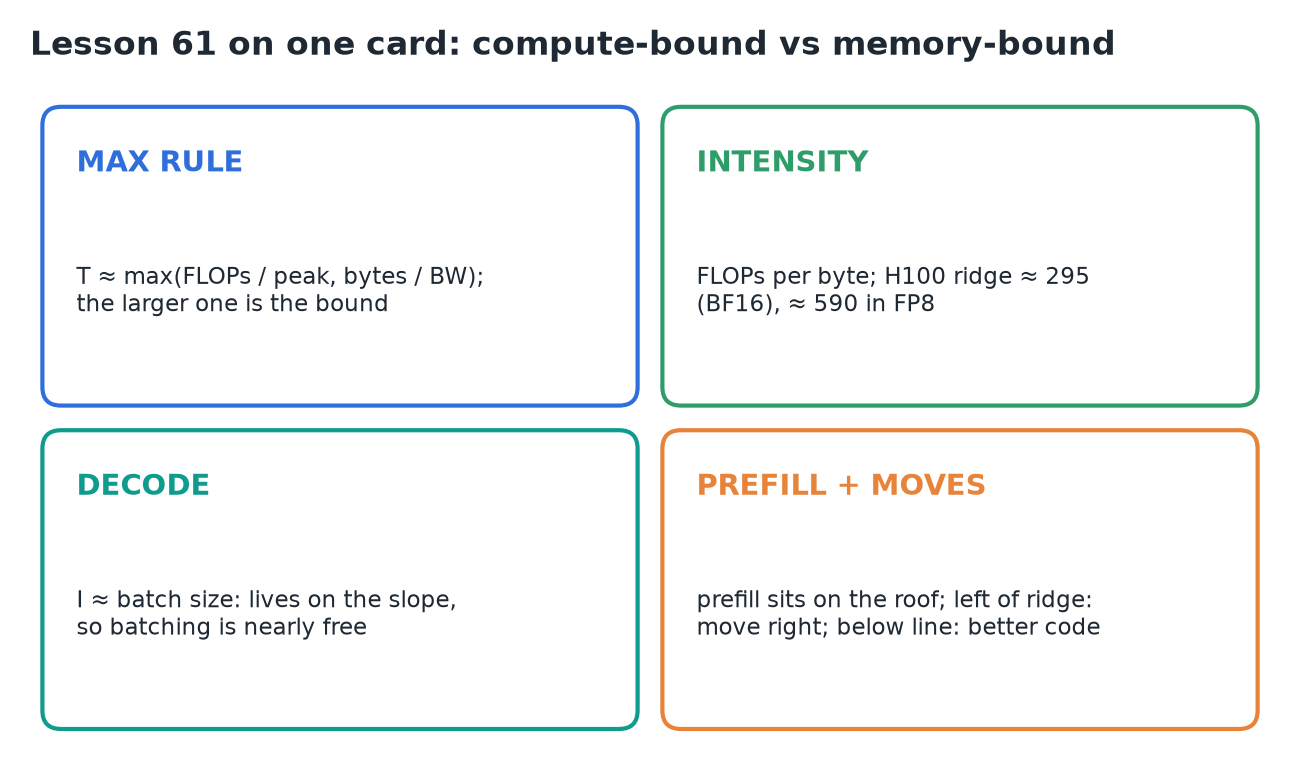
Every kernel does some math and moves some bytes, and takes about as long as the larger of the two. Compare the kernel's arithmetic intensity (FLOPs per byte) to the chip's ridge point (peak FLOPS ÷ bandwidth, ≈ 295 on an H100 in BF16): below it you're memory-bound and more TFLOPS changes nothing; above it you're compute-bound and more bandwidth changes nothing. The roofline plots this. Decode GEMMs have intensity ≈ batch size, so they live on the slope and batching is nearly free; prefill lives on the roof.
1. The max rule
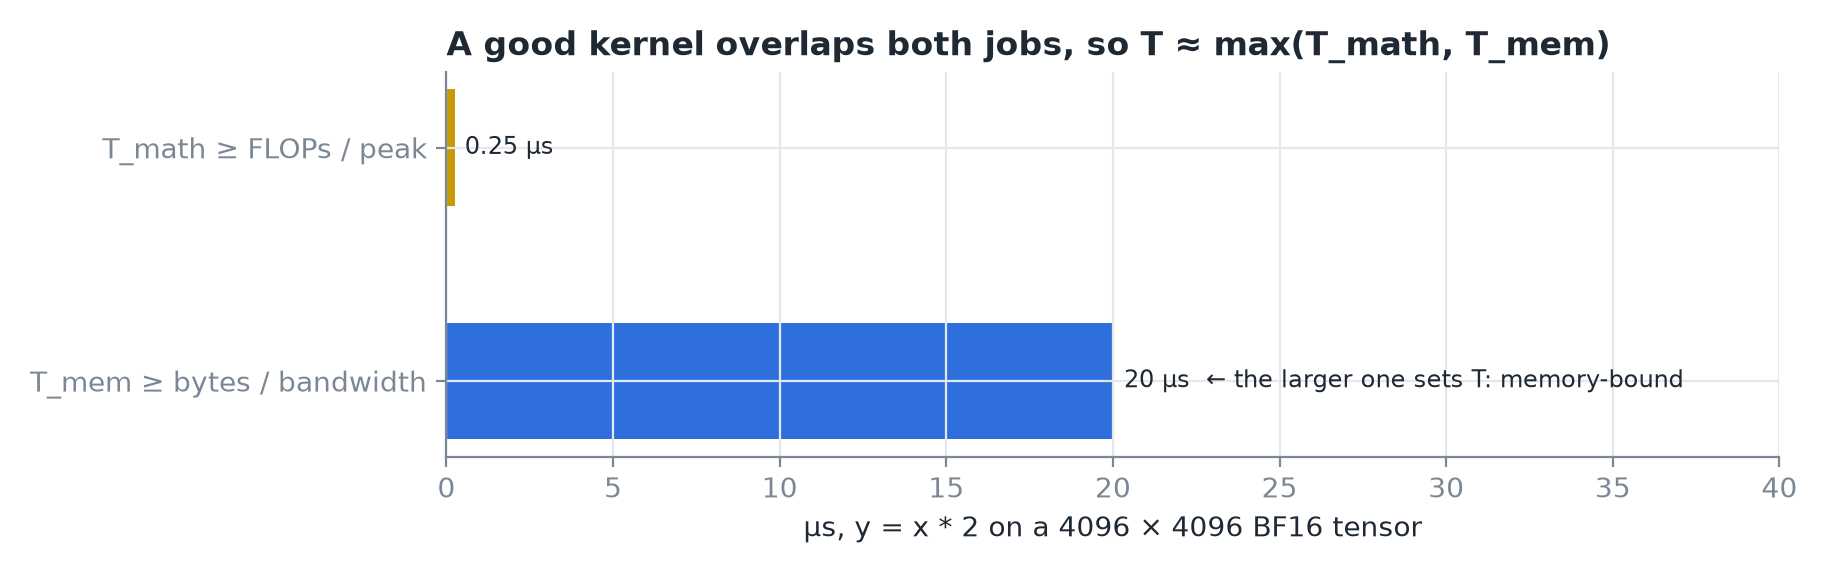 The multiply-by-two kernel on an H100.
- A good kernel overlaps the two jobs, so the total is about the larger one.
- Math bigger → compute-bound. Bytes bigger → memory-bound.
y = x * 2: math ≈ 0.25 µs, bytes ≈ 20 µs. Memory-bound by a mile.
2. Two ratios instead of two times
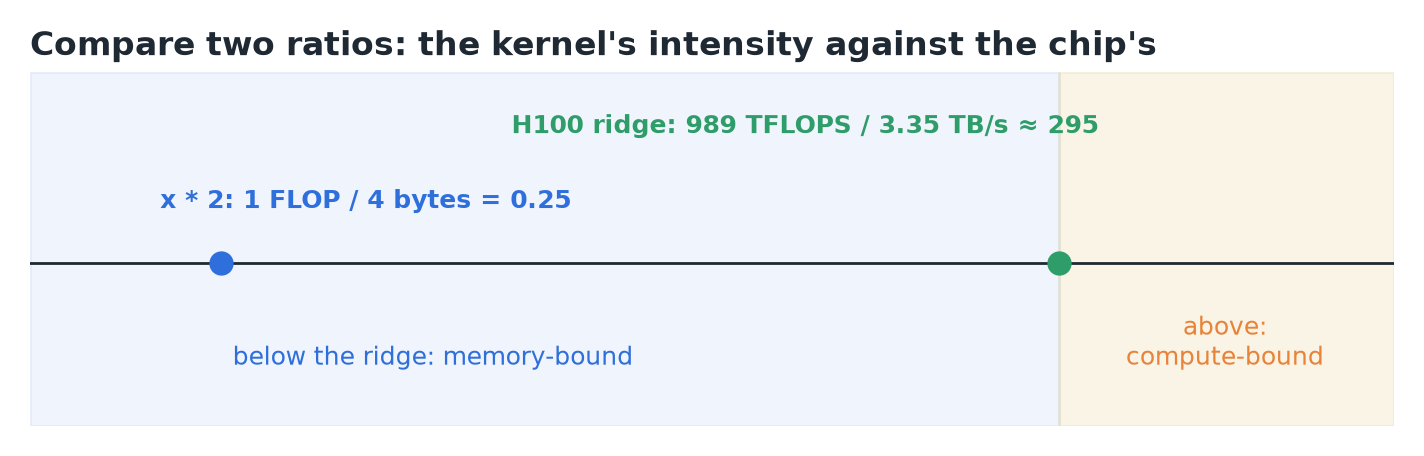 Kernel intensity against the chip's ridge.
- Arithmetic intensity: how much math a kernel does per byte it touches. Multiply by two does 1 FLOP per 4 bytes (2 read, 2 written in BF16): I = 0.25.
- The chip's ratio: to keep the math units busy, every byte brought in must pay for ≈ 295 operations.
- Below the ridge: memory-bound. Above: compute-bound.
3. The roofline
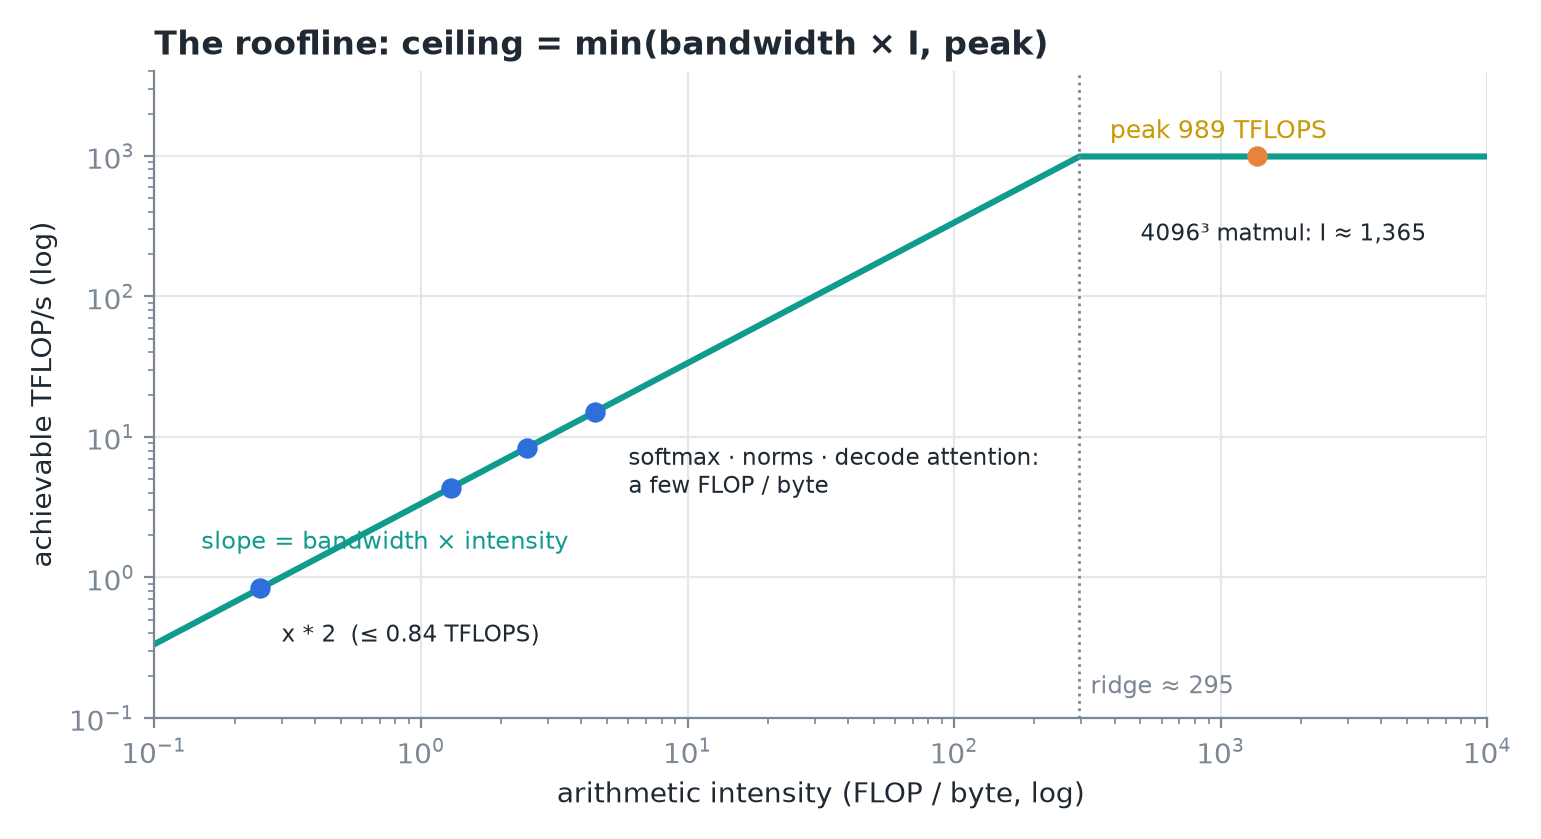 Both axes log scale.
- Horizontal: intensity. Vertical: achievable FLOPS.
- Memory-bound ceiling: bandwidth × intensity, a slanted line.
- Compute-bound ceiling: the chip's peak, a flat roof.
- Your ceiling is the lower of the two; they meet at the ridge (295).
- Where real ops land:
- elementwise multiply (I = 0.25): far down the slope, capped at ≤ 0.84 TFLOPS;
- softmax, layer norms, single-token attention: a few FLOPs per byte, also on the slope;
- 4096 × 4096 square matmul: I > 1,000 (◆ 2N³ FLOPs ÷ 3 × 2N² bytes ≈ 1,365), up on the roof.
4. Why this picture runs inference
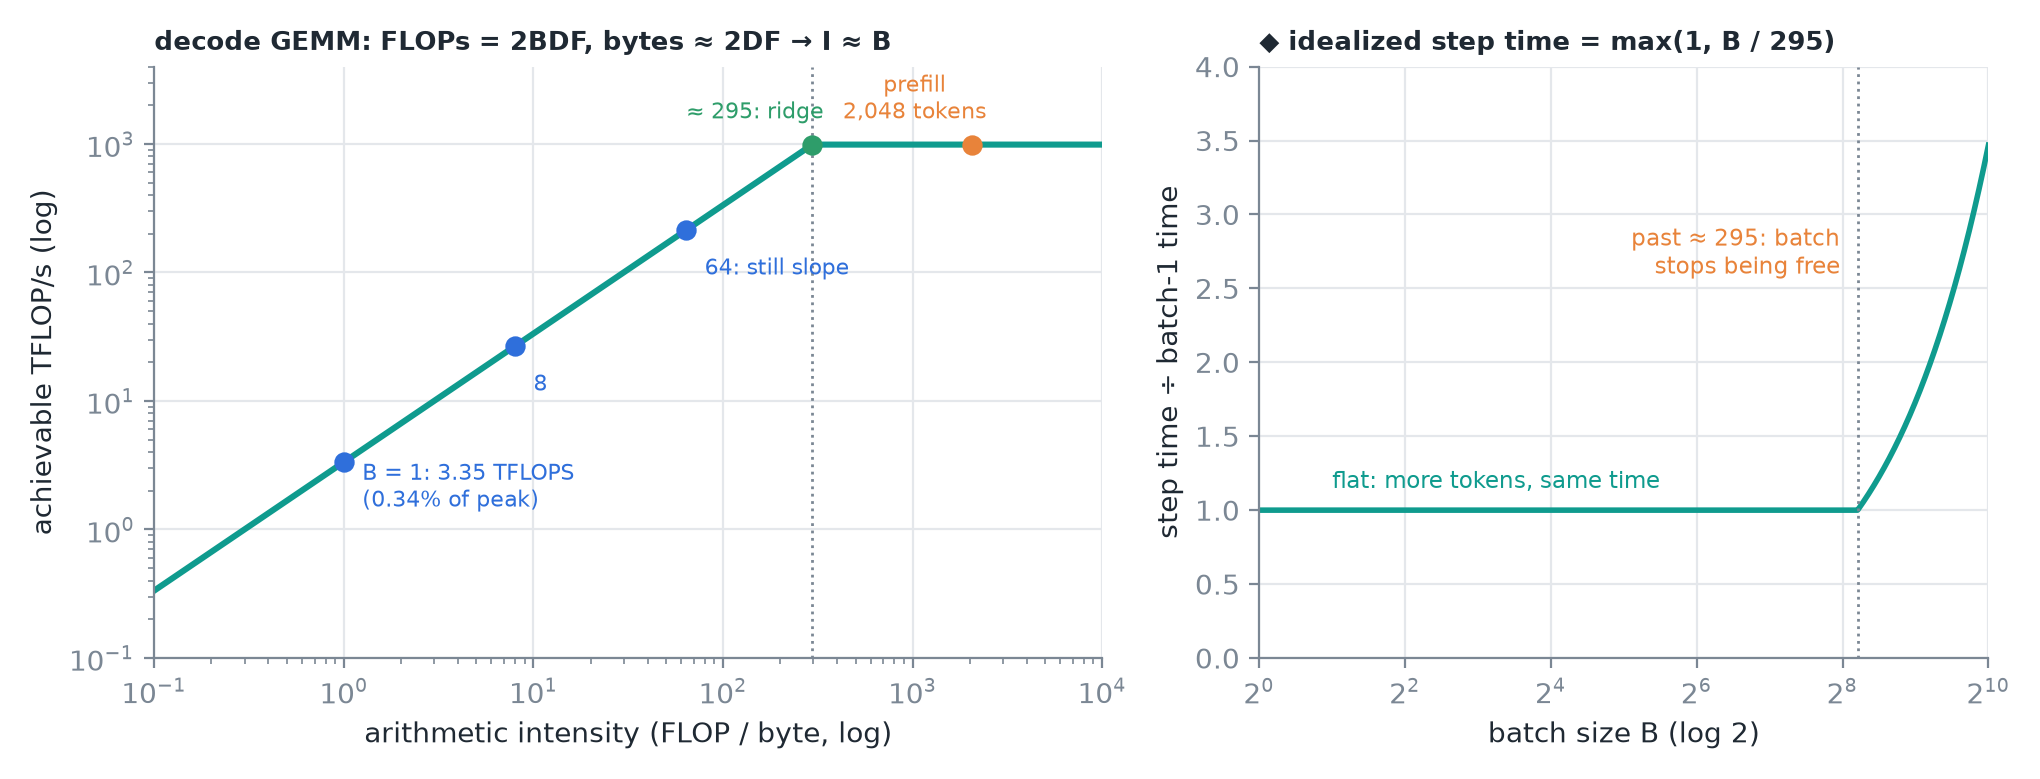 The right panel is my idealized model of a decode GEMM's step time.
- In decode, the biggest kernels multiply B token vectors by a huge D × F weight matrix.
- FLOPs grow with the batch, but the bytes are almost all weights, read once no matter the batch. So intensity ≈ batch size.
- B = 1: I ≈ 1, capped at 3.35 TFLOPS, about ⅓ of 1% of peak.
- Grow the batch: the point slides up the slope; each step gives more tokens for almost the same time.
- B = 64: still memory-bound; 64 tokens instead of 1 for about the same time.
- A few hundred (≈ 295): the point reaches the ridge and batching stops being free.
- Prefill is the other extreme: thousands of prompt tokens are one giant batch, on the roof.
5. Using the roofline
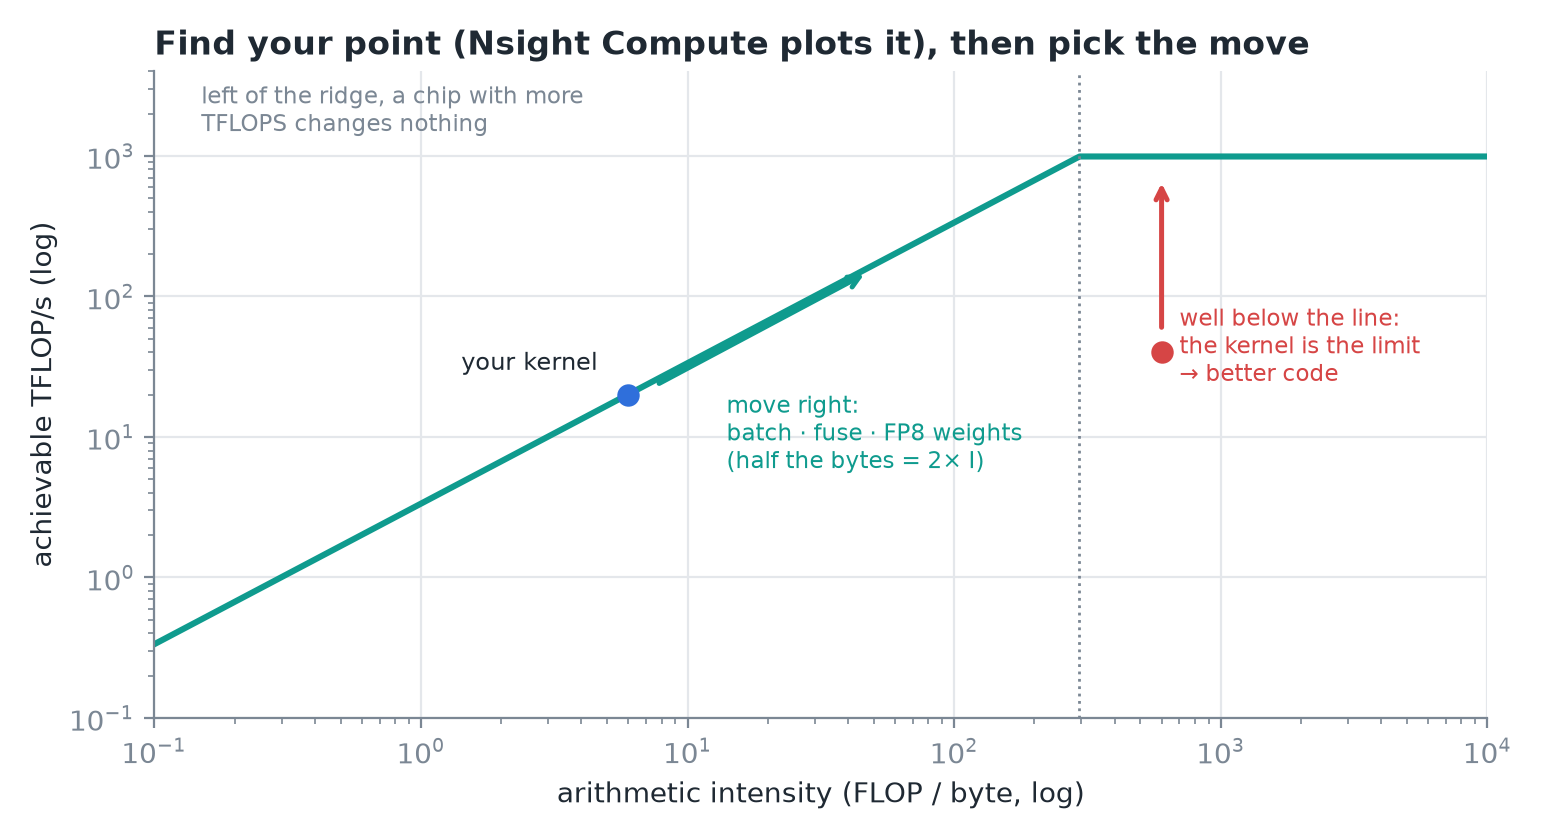 Two different diagnoses, two different moves.
- Find your point. Nsight Compute's roofline chart plots each kernel for you.
- Left of the ridge: a faster chip's math won't help. Move right:
- batch more work together;
- fuse kernels so bytes aren't reloaded;
- store weights in fewer bits: FP8 halves the bytes and doubles the intensity.
- Well below the line: the hardware isn't the limit, the kernel is. That's a job for better code.
6. Two cautions
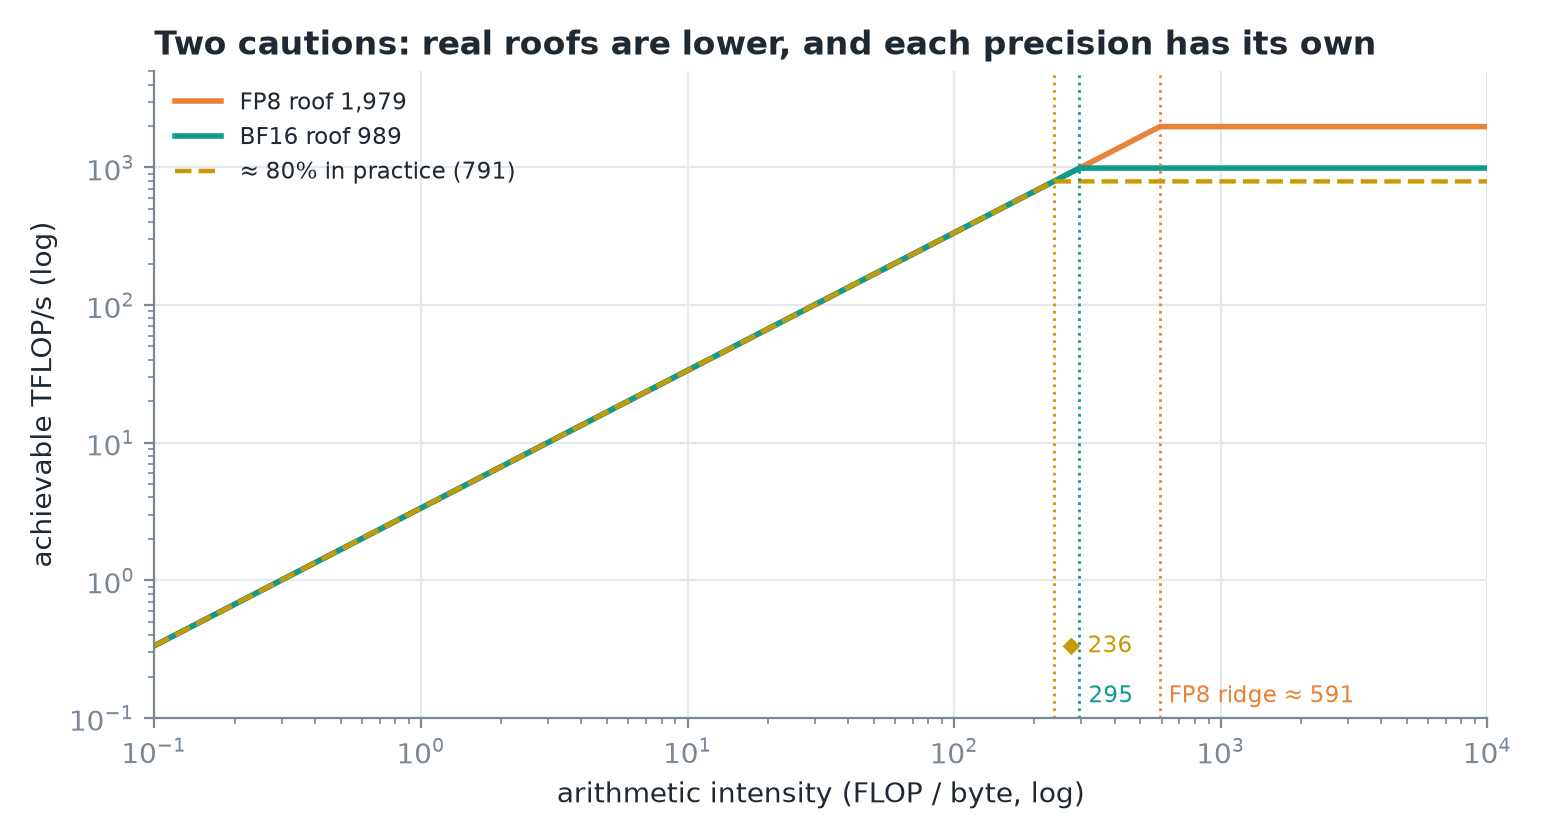 The datasheet roof is an upper bound.
- Real roofs are lower than datasheet roofs: H100s tend to reach ≈ 80% of peak FLOPS. ◆ At 80% (≈ 791 TFLOPS) the ridge moves in to ≈ 236.
- Each precision has its own roof. In FP8 the peak doubles to 1,979 TFLOPS, so the ridge moves out to ≈ 590.
- ◆ FP8 weights double a decode GEMM's intensity (I ≈ 2B), so on the FP8 roof the ridge is still reached at a batch of ≈ 295. With FP8 weights but BF16 math, it's reached at ≈ 148.
IMPORTANT
Know which side of the ridge a kernel sits on before optimizing. Left of it, buy bandwidth or move right; right of it, buy FLOPS; far below the line, fix the code.
7. Recap