21 · Concurrency, Request Rate & Arrival Patterns
Source: fanout.sh / inference-eng / 04-02 · ~6 min
NOTE
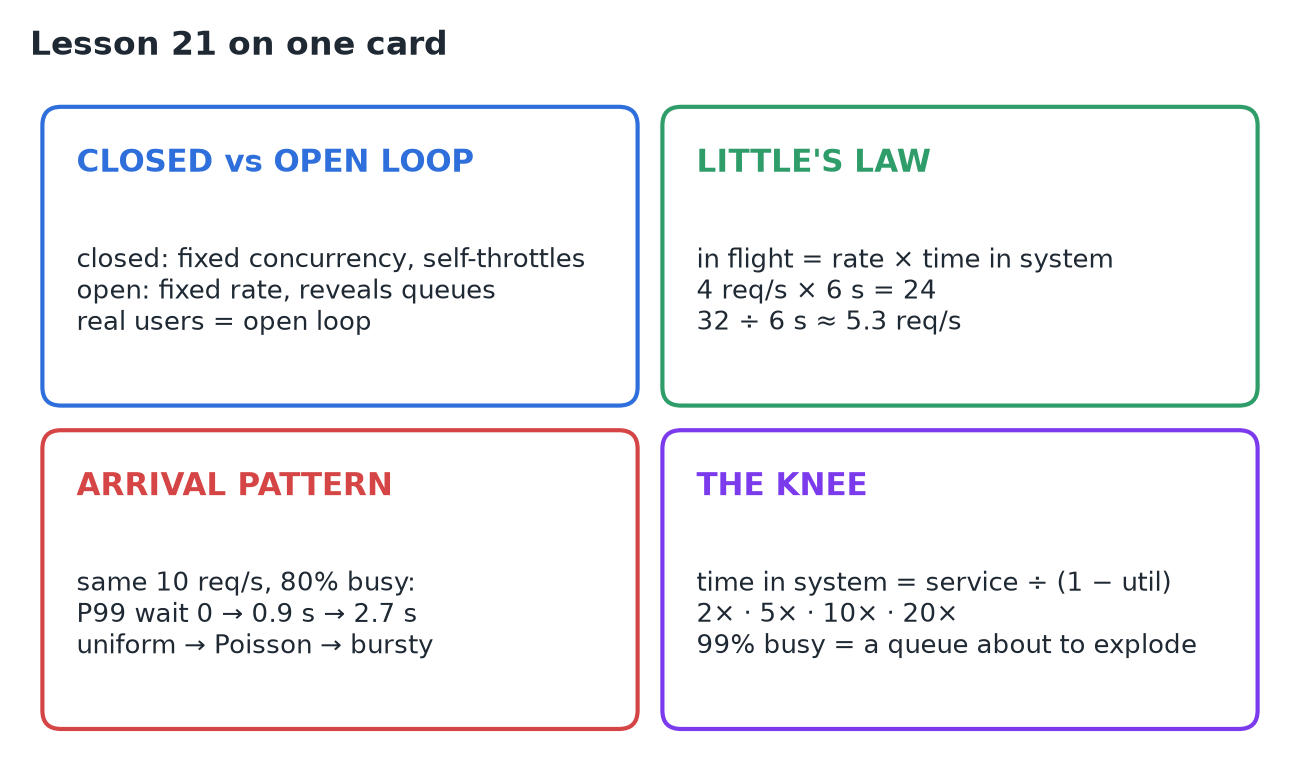
How you generate load (how many at once, how many per second, and exactly when they arrive) changes every number you measure, so two teams can report great TTFT and terrible tails on the same server. A closed loop (fixed concurrency) slows down with the server; an open loop (fixed rate) keeps arriving and reveals the queue real users feel. Little's law links them: in flight = rate × time in system (4 req/s × 6 s = 24). At the same 10 req/s on a server 80% busy, P99 wait goes 0 → 0.9 s → 2.7 s from uniform to Poisson to bursty arrivals. Time in system grows as 1 ÷ (1 − utilization): 2×, 5×, 10×, 20× at 50, 80, 90, 95%. That's the knee.
1. Closed loop vs open loop
- Fixed concurrency (closed loop): e.g. 8 virtual users, each sends, waits for the answer, then immediately sends again. Always exactly 8 in flight.
- Request rate (open loop): requests arrive on a schedule, e.g. 10 per second, whether or not earlier ones finished.
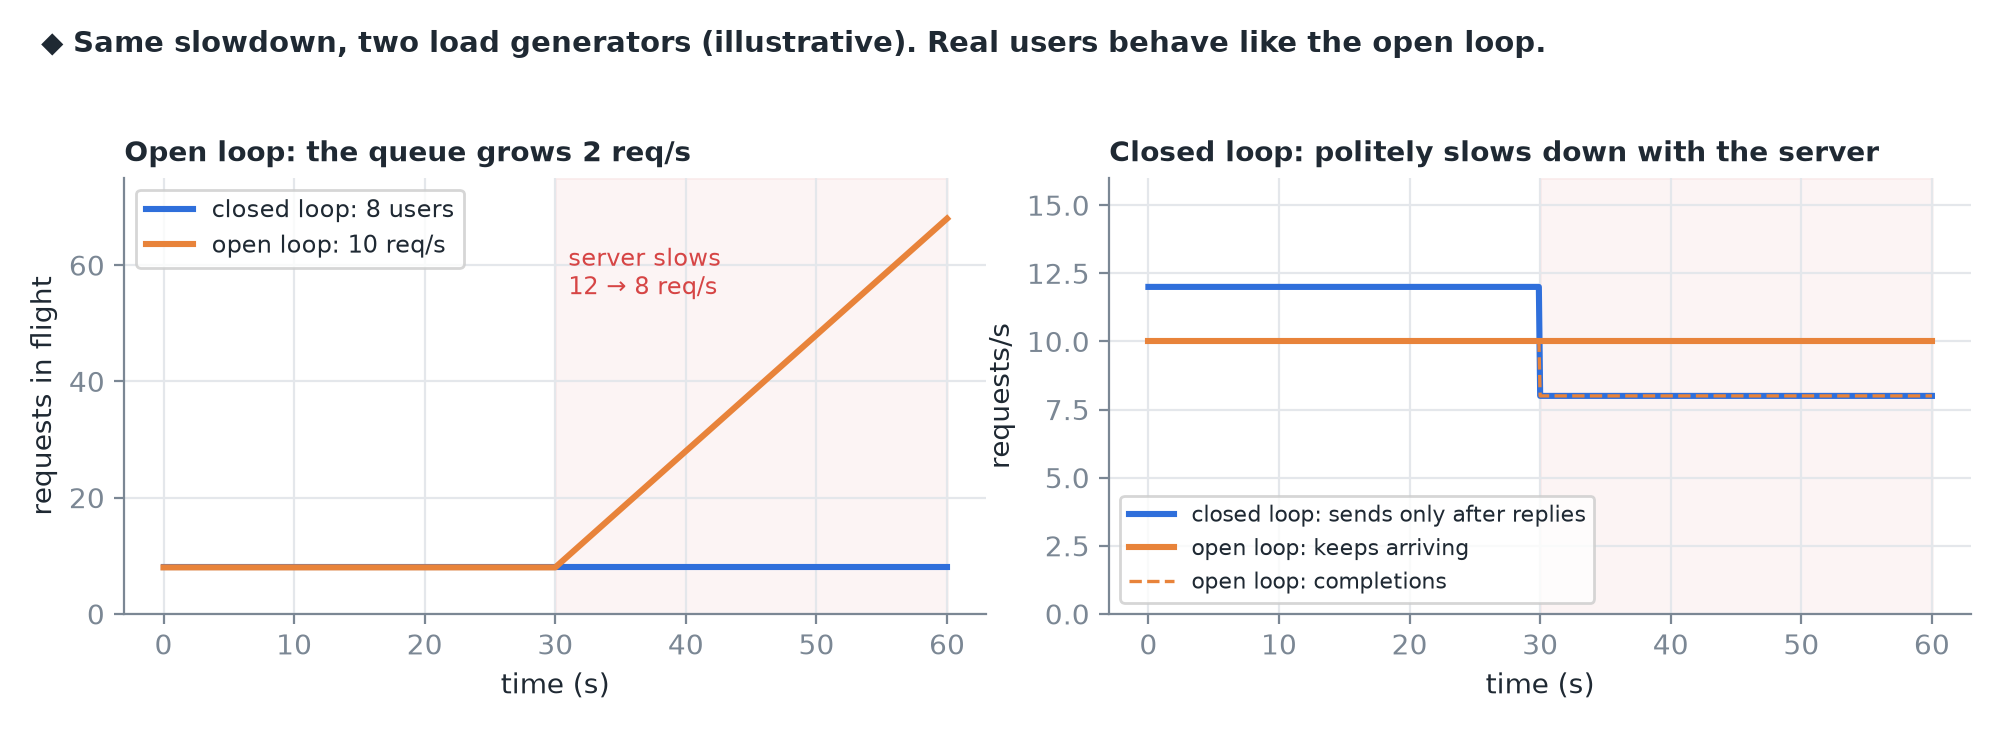 When the server slows, the closed loop sends less (its users are waiting), so nothing piles up. The open loop keeps arriving and the queue grows.
IMPORTANT
Real internet users behave like the open loop. A closed-loop test can hide exactly the queueing your users will feel.
2. Little's law
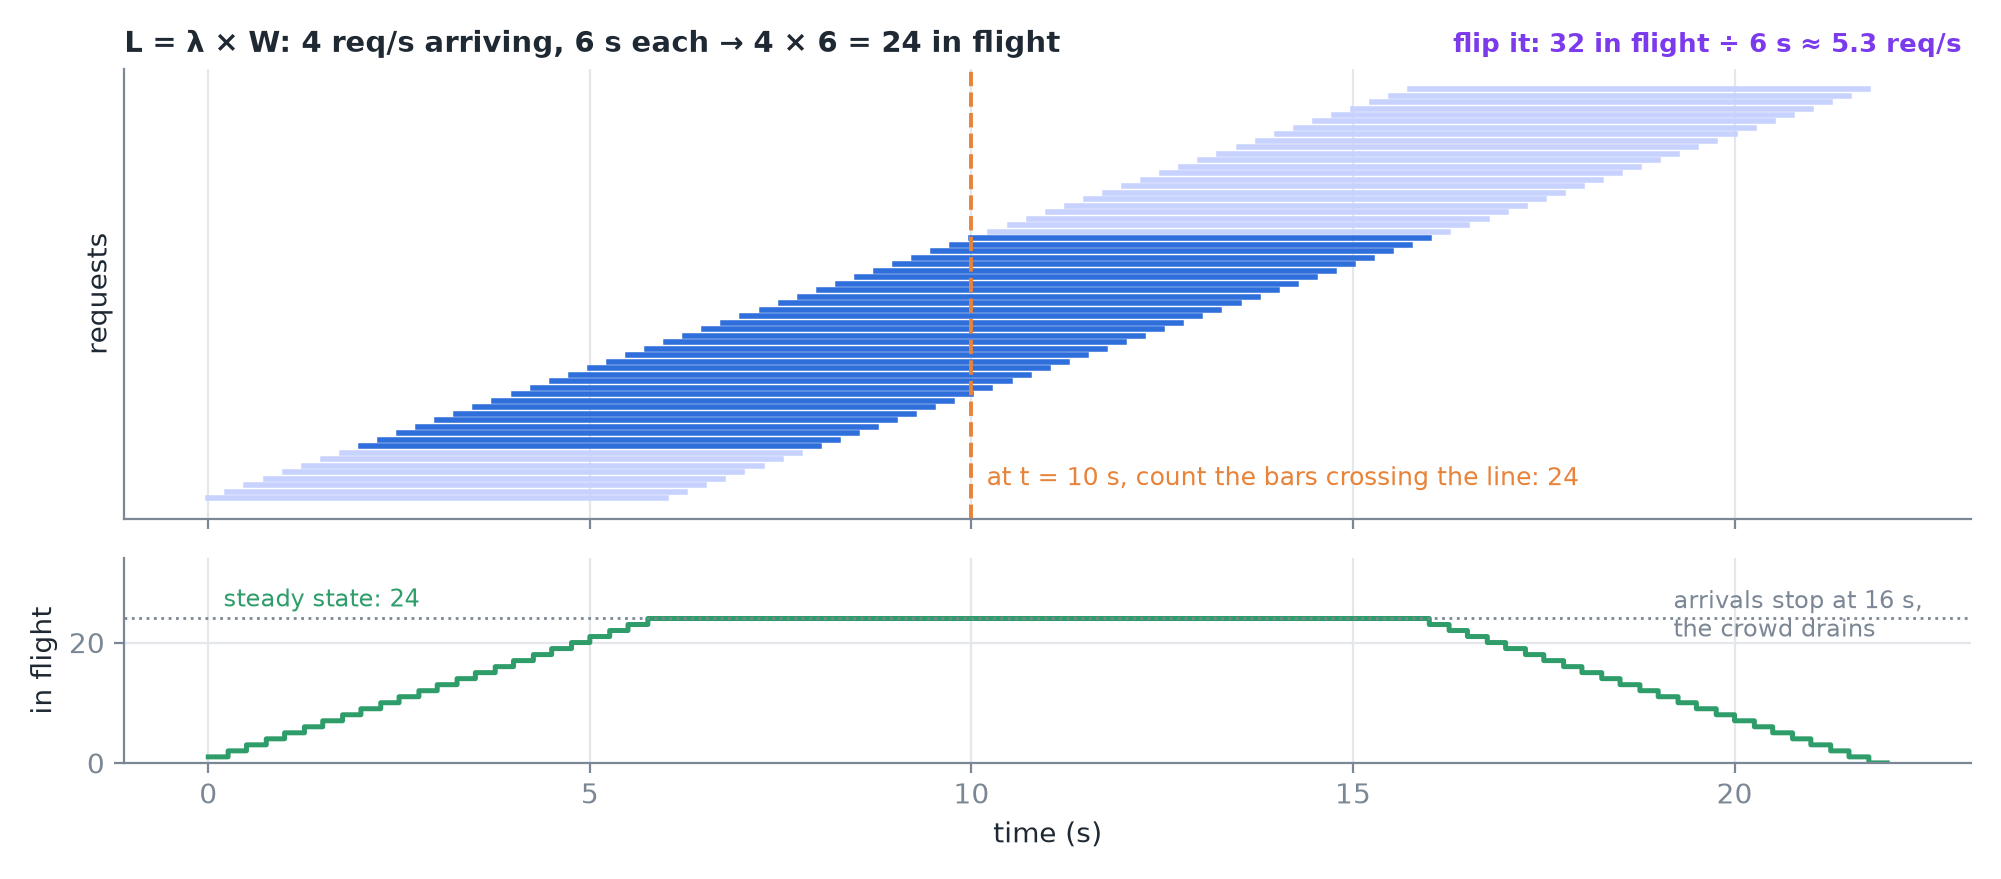 4 requests arrive per second and each takes 6 s end to end, so 24 are in flight on average. Flip it: 32 in flight at 6 s each means ≈ 5.3 req/s served.
- It translates between a concurrency test and a rate test.
- It warns you: if requests arrive faster than they finish, time in system keeps growing, and so does the crowd.
3. Arrival patterns
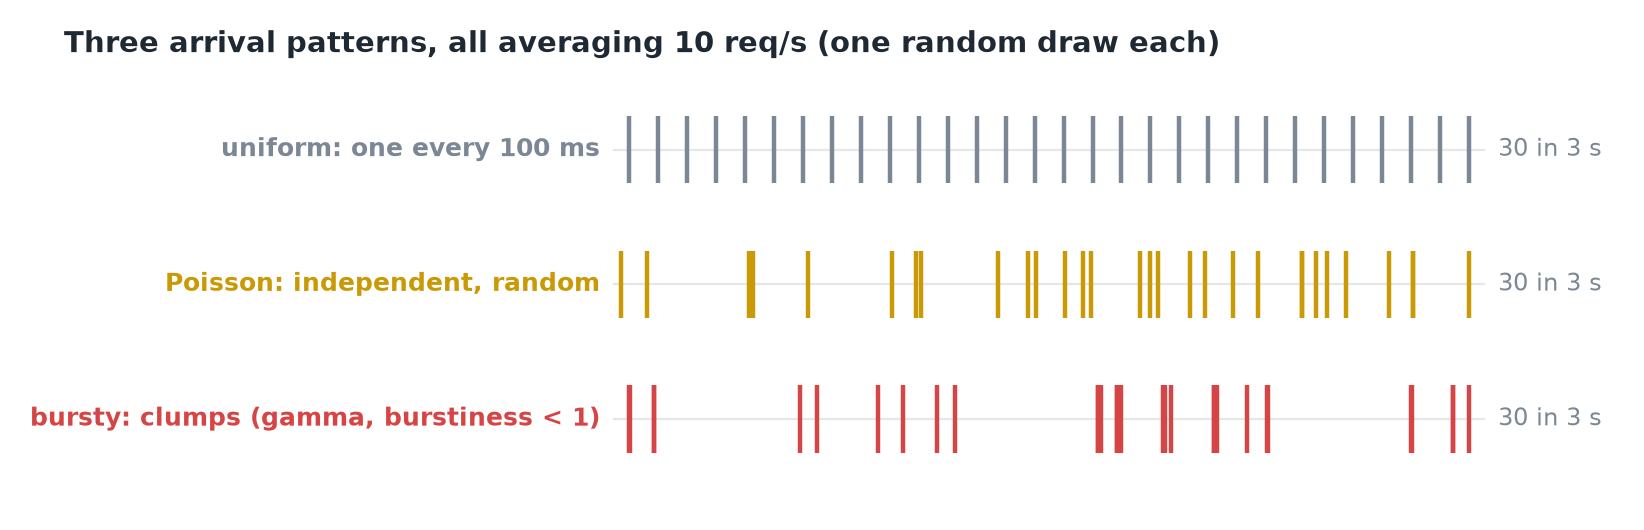 Same average, different timing.
| Pattern | Looks like | Models |
|---|---|---|
| Uniform | One every 100 ms, a metronome | Almost no real traffic |
| Poisson | Independent, random: pairs and gaps | Many independent users |
| Bursty | Clumps | Batch jobs, a feature going viral; benchmark tools use a gamma distribution with burstiness < 1 |
Feed all three into the same simulated server: 80 ms per request at 10 req/s, so busy 80% of the time.
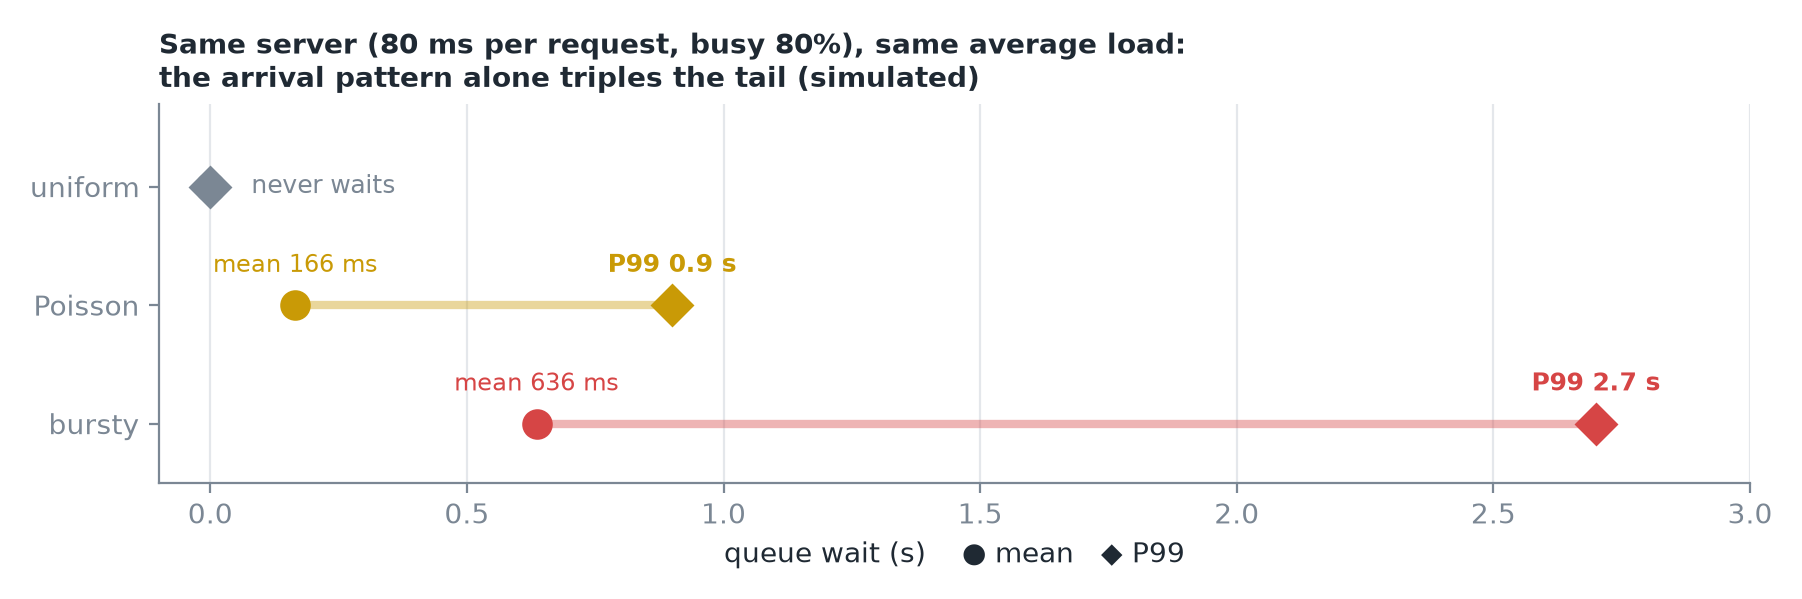 Uniform never waits. Poisson: mean 166 ms, P99 0.9 s. Bursty: mean 636 ms, P99 2.7 s.
IMPORTANT
Same average load: the pattern alone changed the tail by 3×.
4. The knee
In a simple queue, time in system relative to the bare service time grows as 1 ÷ (1 − utilization).
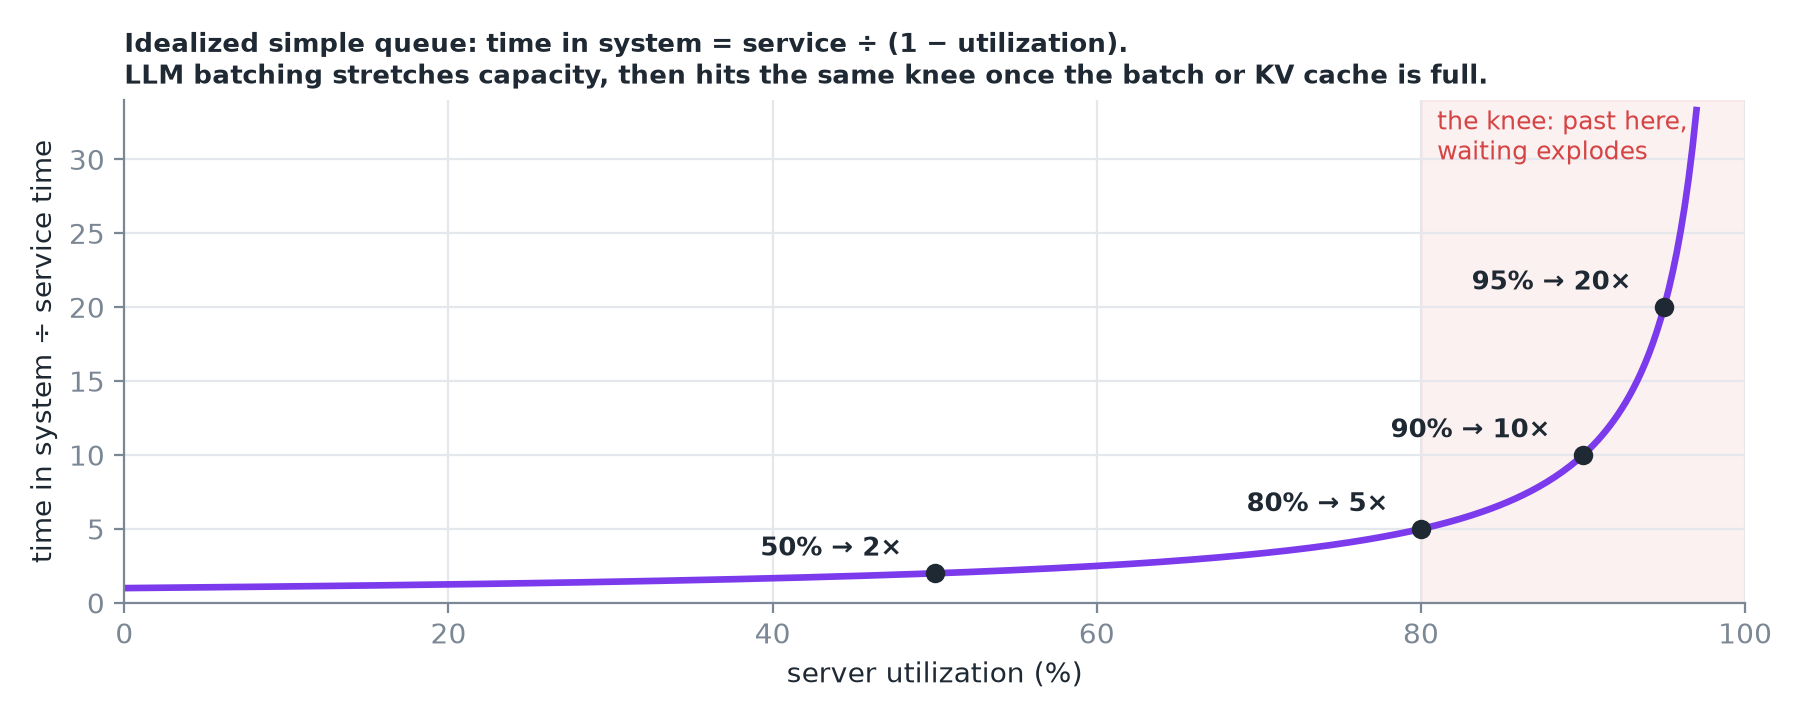 Gentle at half load, vertical near full load.
- LLM servers batch, so capacity stretches as load grows, but they hit the same knee once the batch or the KV cache is full.
CAUTION
A GPU at 99% busy isn't efficient: it's a queue waiting to explode.
5. How to generate load
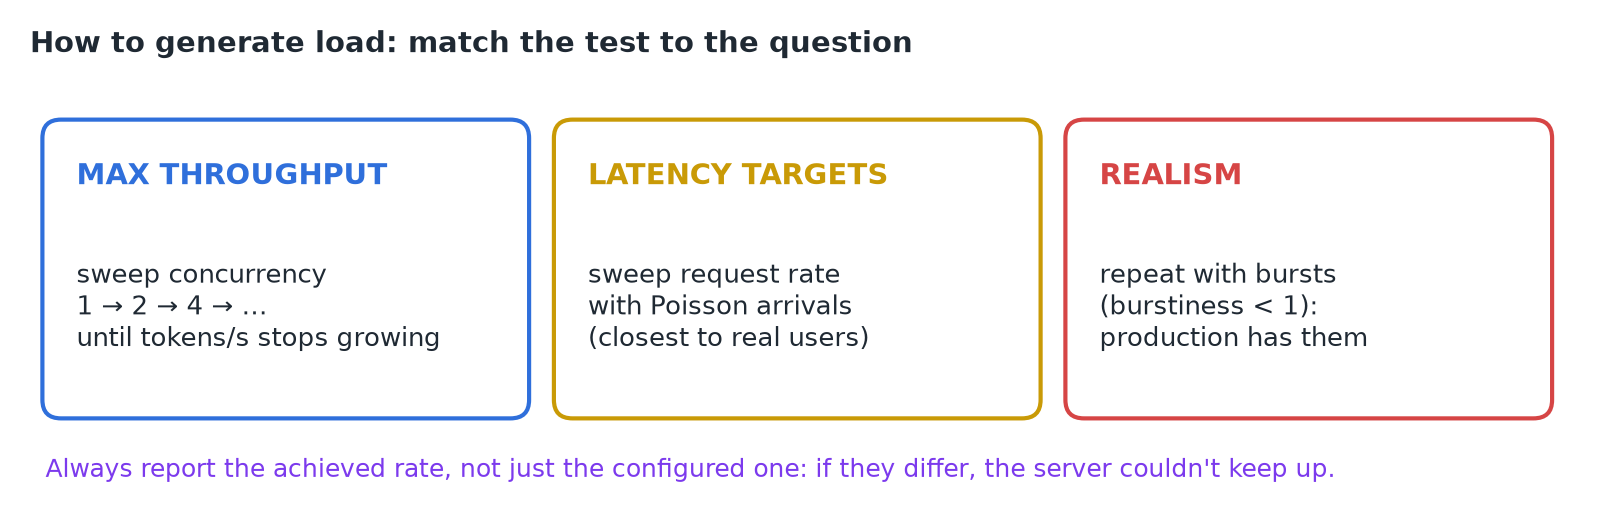
vLLM's benchmark exposes exactly these knobs:
vllm bench serve \
  --request-rate 10 \
  --burstiness 0.5 \
  --max-concurrency 64
6. Recap