22 · P50, P95, P99 & Variance
Source: fanout.sh / inference-eng / 04-05 · ~6 min
NOTE
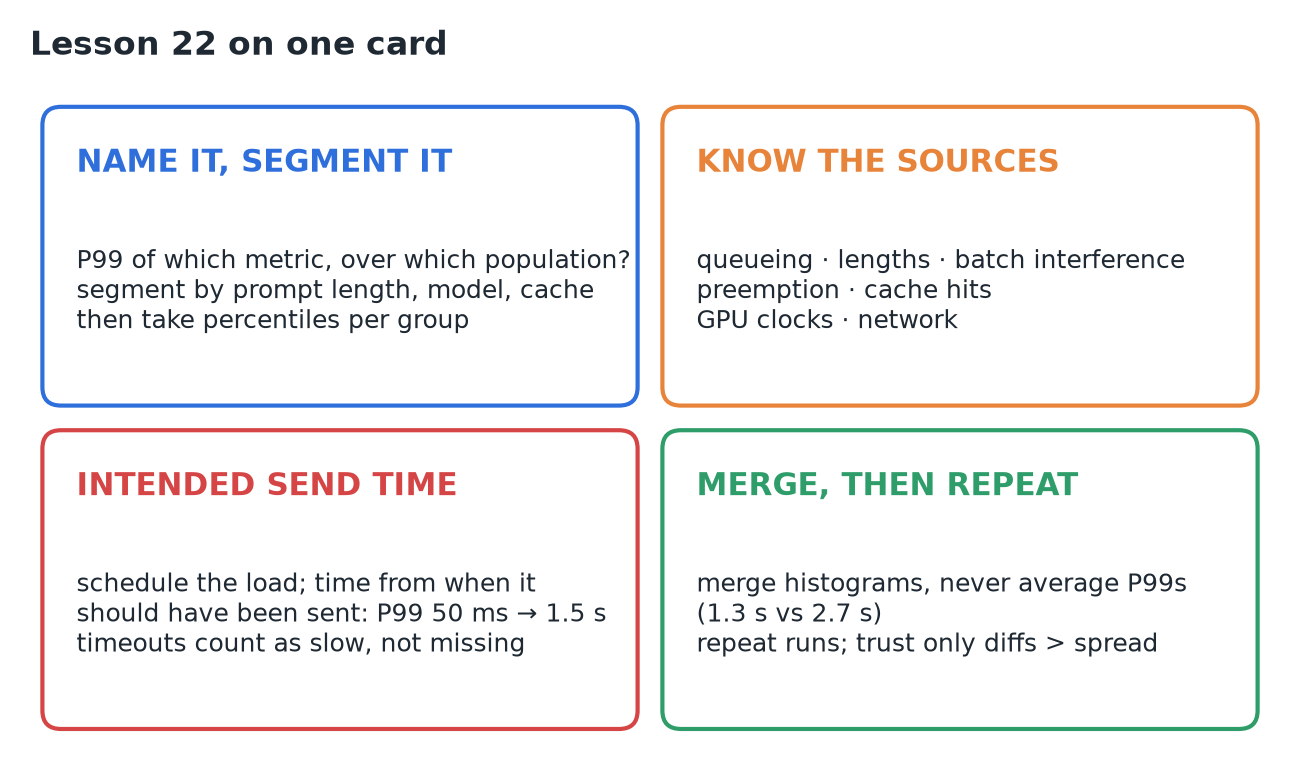
Knowing what a percentile is is easy; using one on an LLM server without fooling yourself is not. First ask P99 of what: which metric, and which population (per request or per token, one traffic mix or a blend). The spread comes from queueing, lengths, batch interference, preemption, cache hits, and the hardware. A client that waits for each reply suffers coordinated omission: it reported P99 = 50 ms where the truth was ≈ 1.5 s. Percentiles don't average (1.3 s vs a true 2.7 s): merge histograms. Medians barely move between runs (54.0, 53.8, 54.0 ms) but tails wander, so repeat and report the spread.
1. P99 of what?
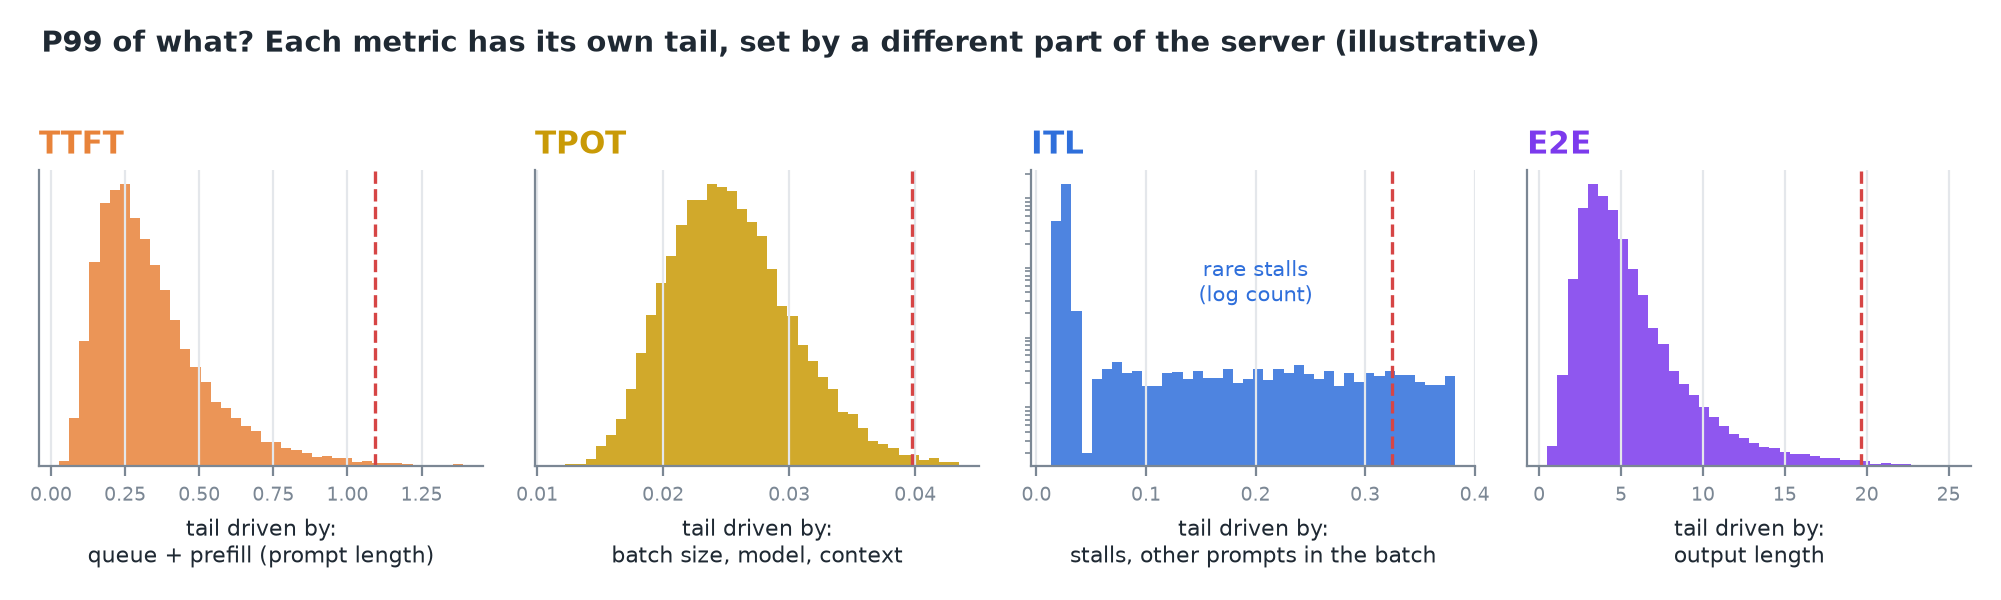 TTFT, TPOT, inter-token gaps and E2E each have their own tail, driven by different parts of the server.
- Population matters. P99 of TPOT across requests counts each request once. P99 of inter-token gaps across all tokens is dominated by long replies, and catches stalls a per-request average smooths away.
- Don't mix populations. Short prompts and long documents in one histogram make two humps.
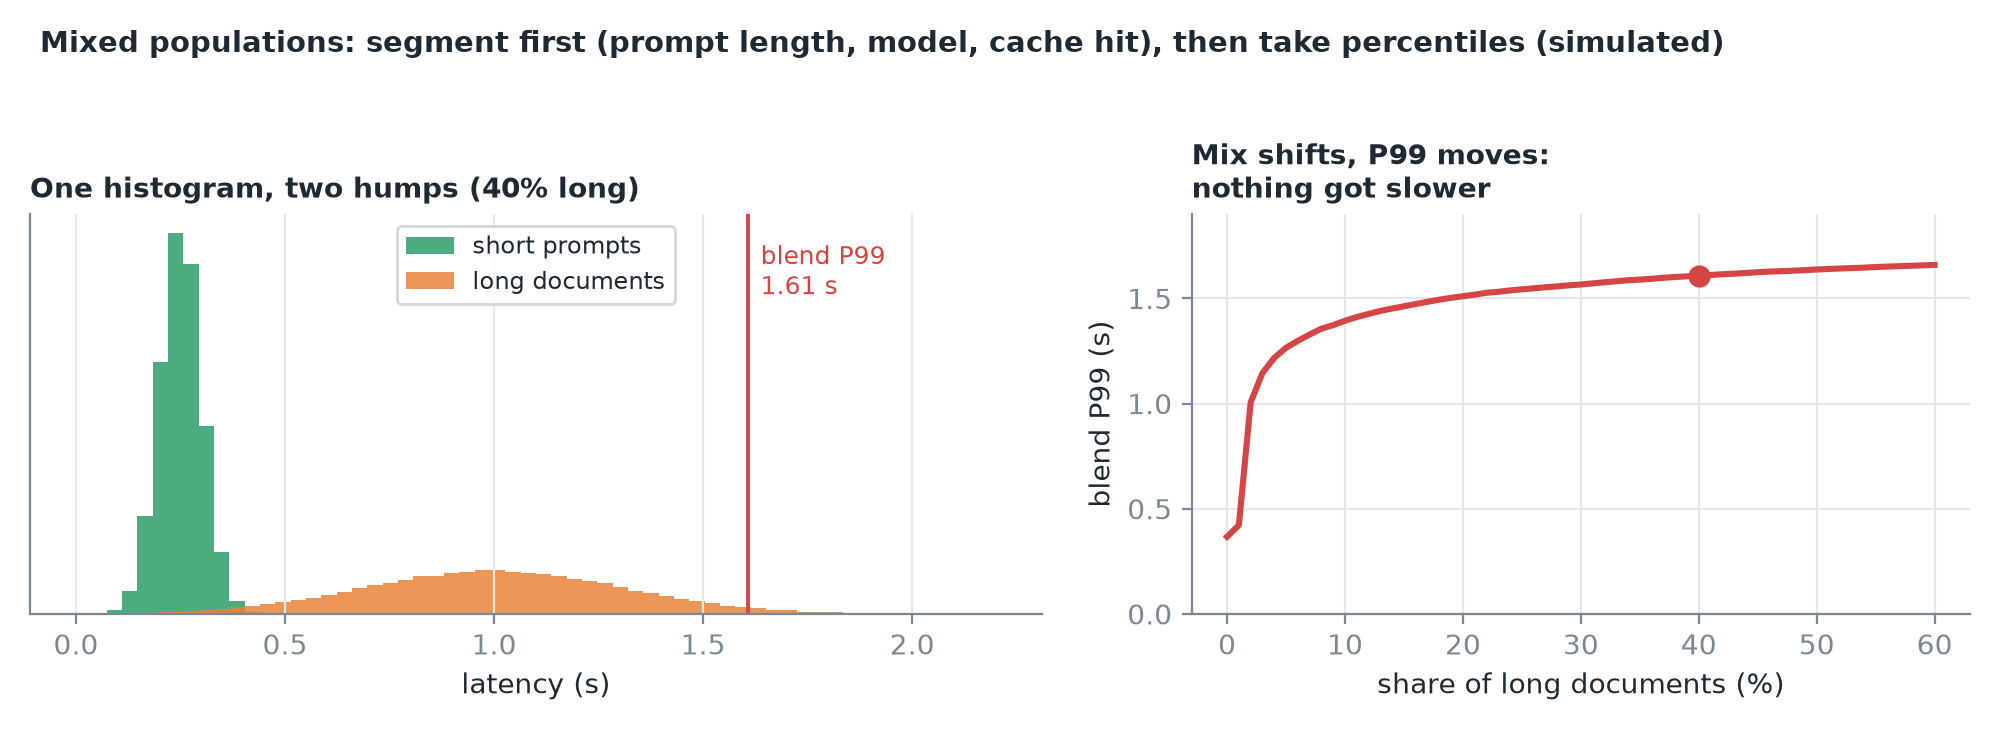 The blend's P99 (1.61 s at 40% long documents) moves whenever the traffic mix changes, even if nothing got slower.
IMPORTANT
Segment first (by prompt length, by model, by whether the prompt was cached), then take percentiles inside each group.
2. Where the spread comes from
| Source | What happens |
|---|---|
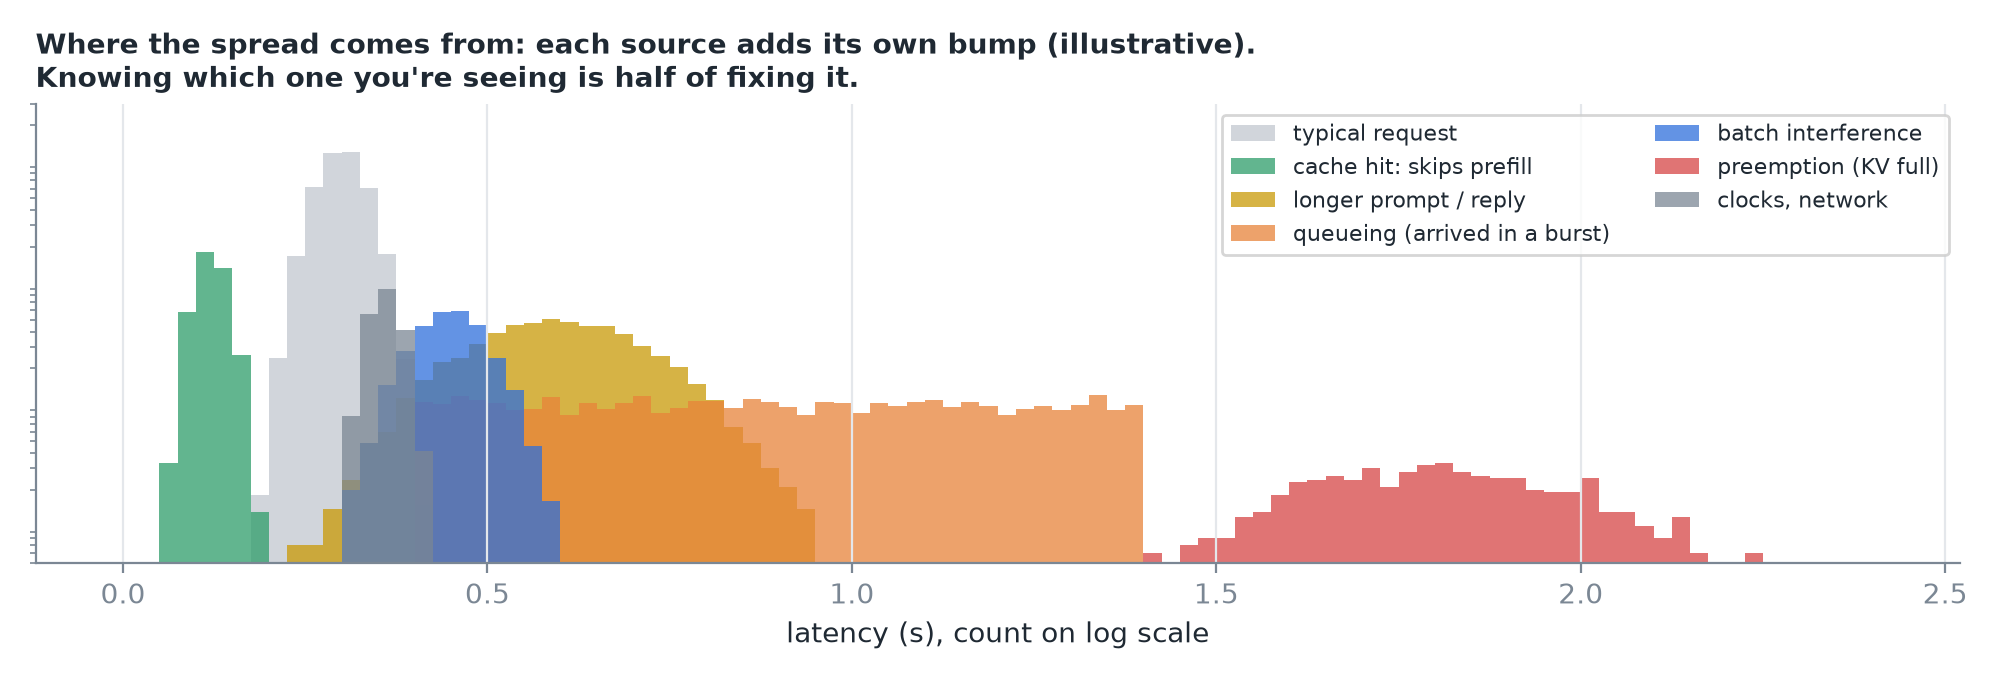
| Queueing | A request arriving during a burst waits behind others |
| Lengths | Longer prompt → longer prefill; longer reply → longer request |
| Batch interference | Someone else's long prompt occupies a step; your next token waits |
| Preemption | KV cache runs out: the engine pauses or even recomputes a request |
| Cache hits | A cached prompt prefix skips most of its prefill |
| The machine | GPU clocks under heat or power limits; the network |
Knowing which one you're seeing is half of fixing it.
3. Coordinated omission
A load generator waits for each response before sending the next. The server stalls for 2 s. The generator records one slow request, and never sends the 20 requests it should have sent during the stall: exactly the ones that would have been slow.
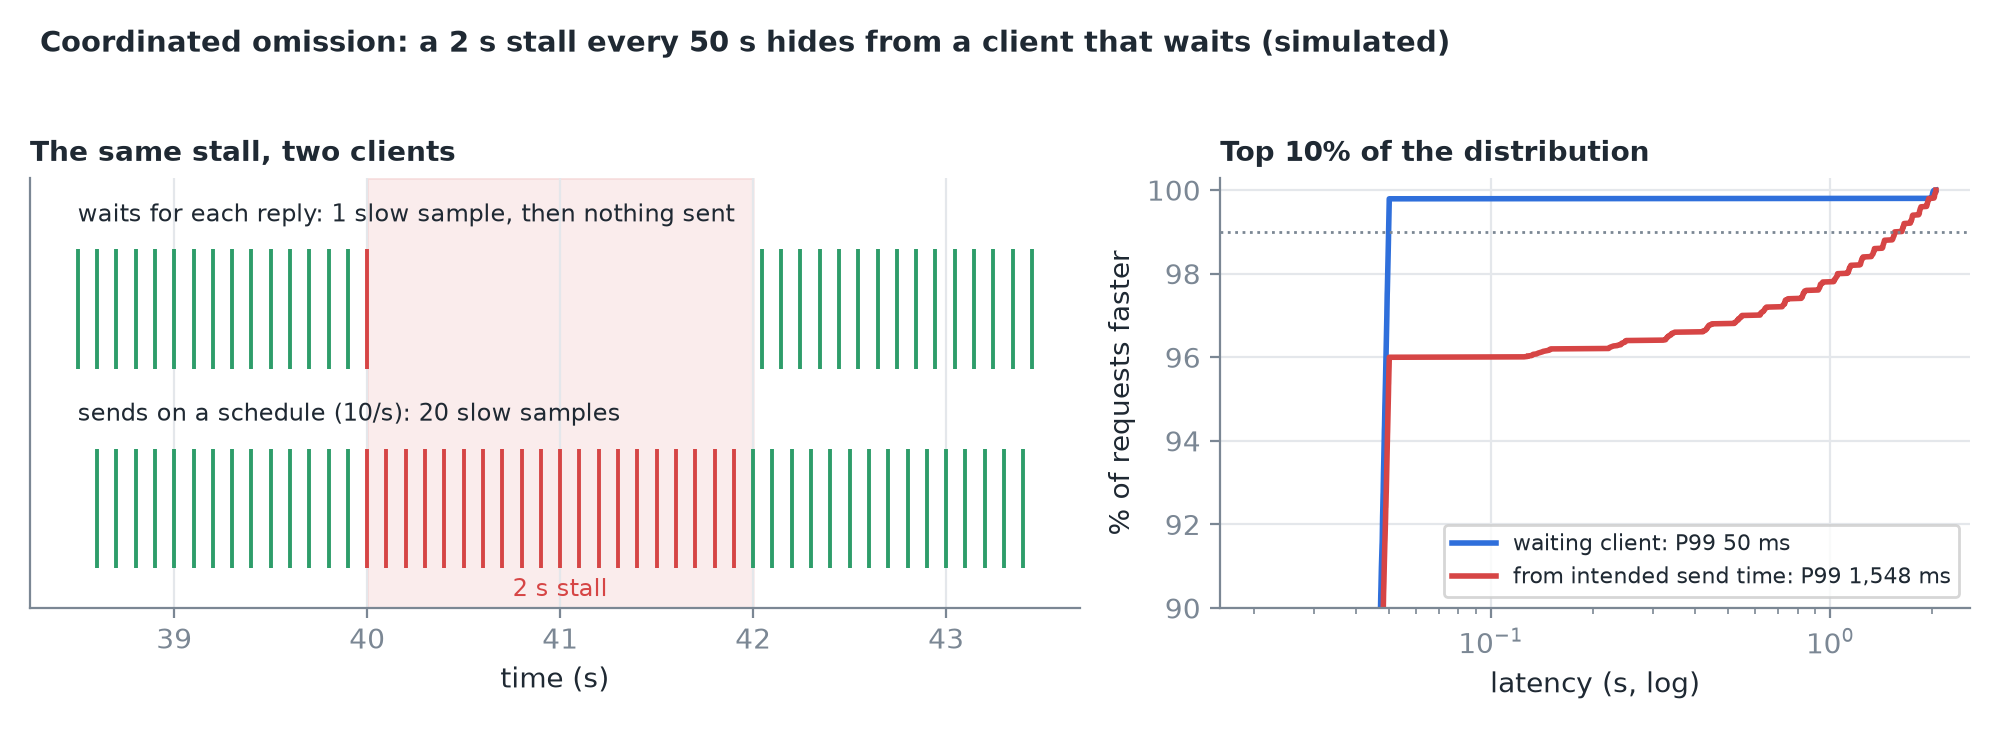 A 2 s stall every 50 s: the waiting client measured P99 = 50 ms; timing from when each request should have been sent, the true P99 is ≈ 1.5 s.
IMPORTANT
Generate load on a schedule and measure latency from the intended send time. Count timeouts as slow results, not missing data.
4. Percentiles don't average
A dashboard stores a P99 every 5 minutes. Eleven windows look fine; one, during an incident, is terrible.
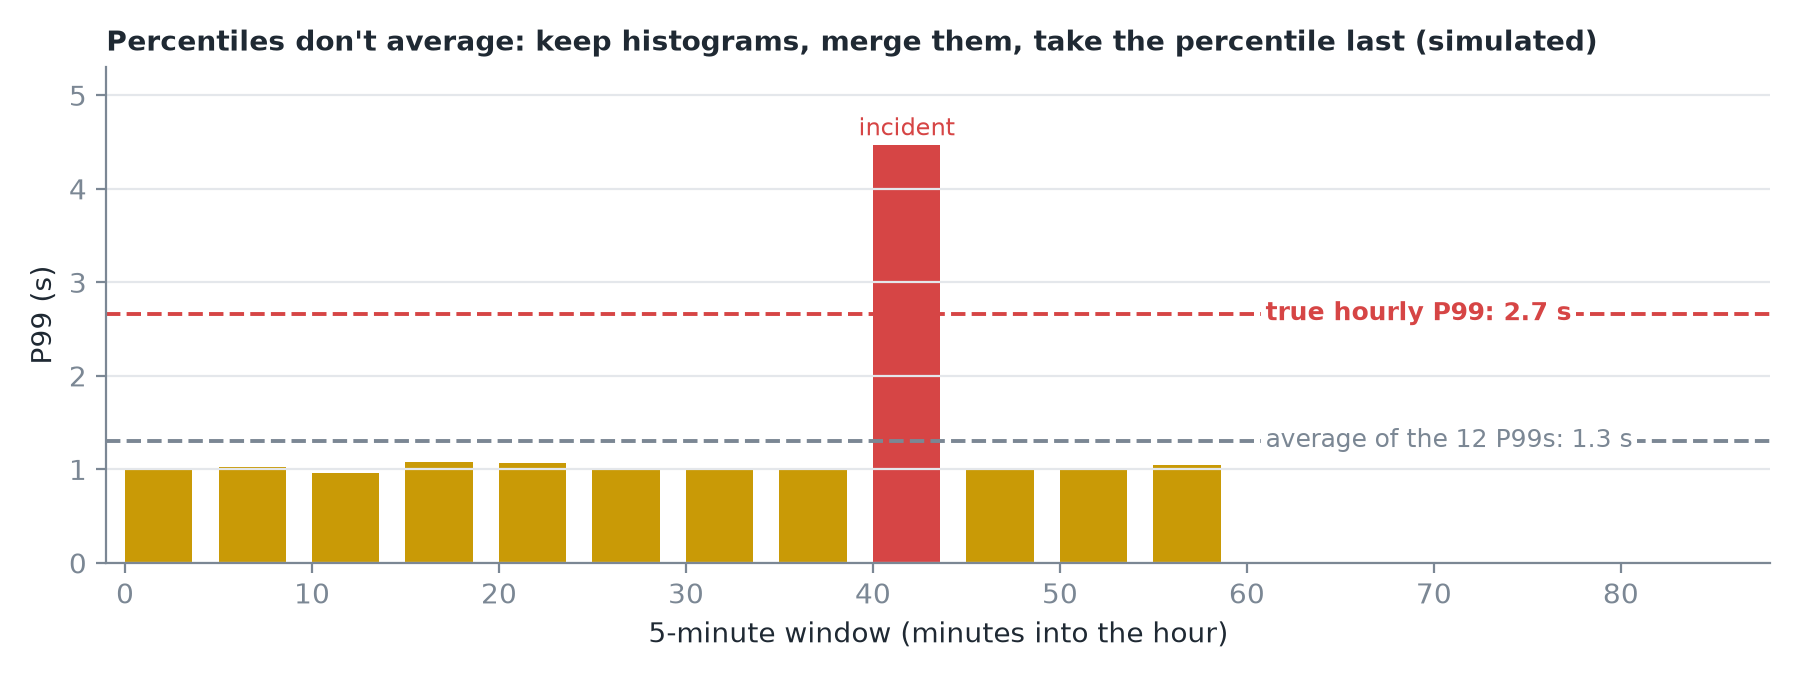 Average of the 12 P99s: 1.3 s. True P99 of the hour: 2.7 s.
IMPORTANT
Percentiles don't add or average. Keep the full distribution as a histogram, merge histograms across windows and machines, and take the percentile last.
5. Run-to-run variance
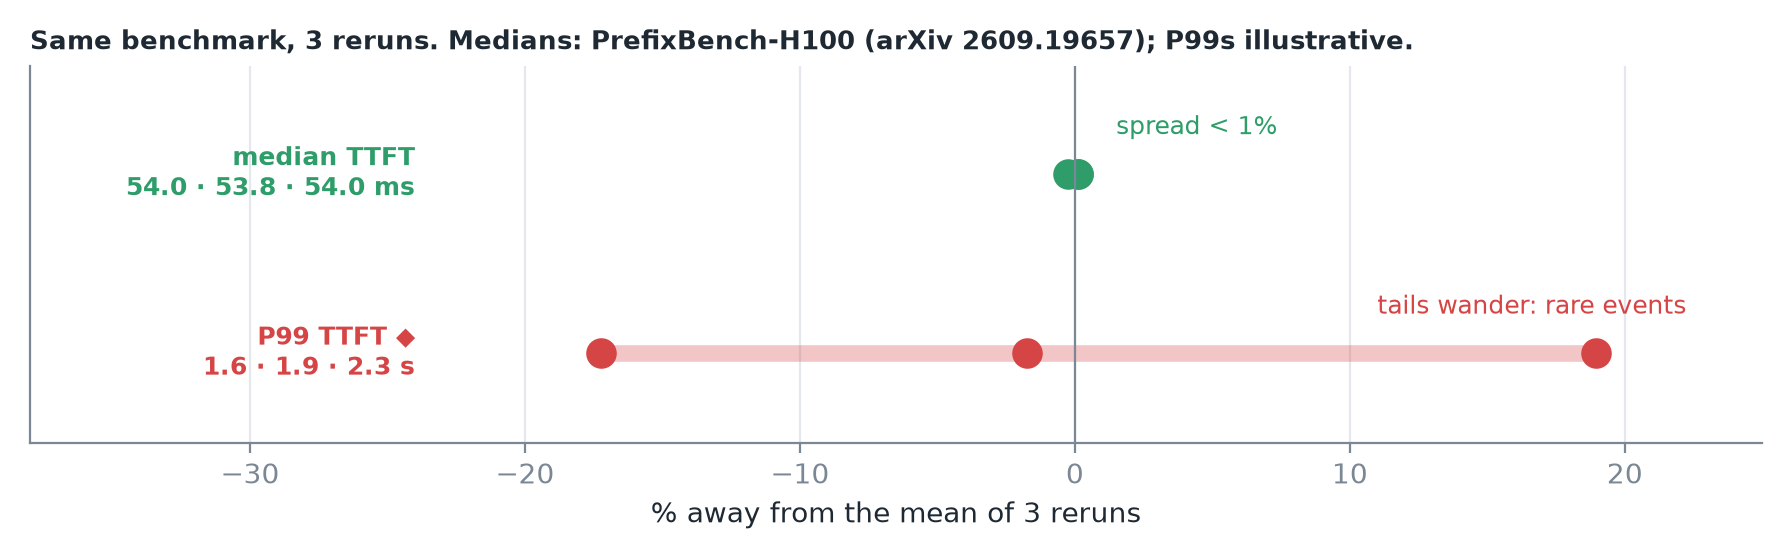 A published H100 study (PrefixBench-H100, arXiv 2609.19657) measured median TTFT of 54.0, 53.8 and 54.0 ms over three runs: under 1% spread. Tails depend on a handful of rare events, so they wander much more.
- Repeat every configuration a few times.
- Report the median of runs with its spread.
- Trust a tail difference only if it's larger than that spread.
6. Recap