24 · Establish the Single-Request Baseline
Source: fanout.sh / inference-eng / 05-01 · ~9 min
NOTE
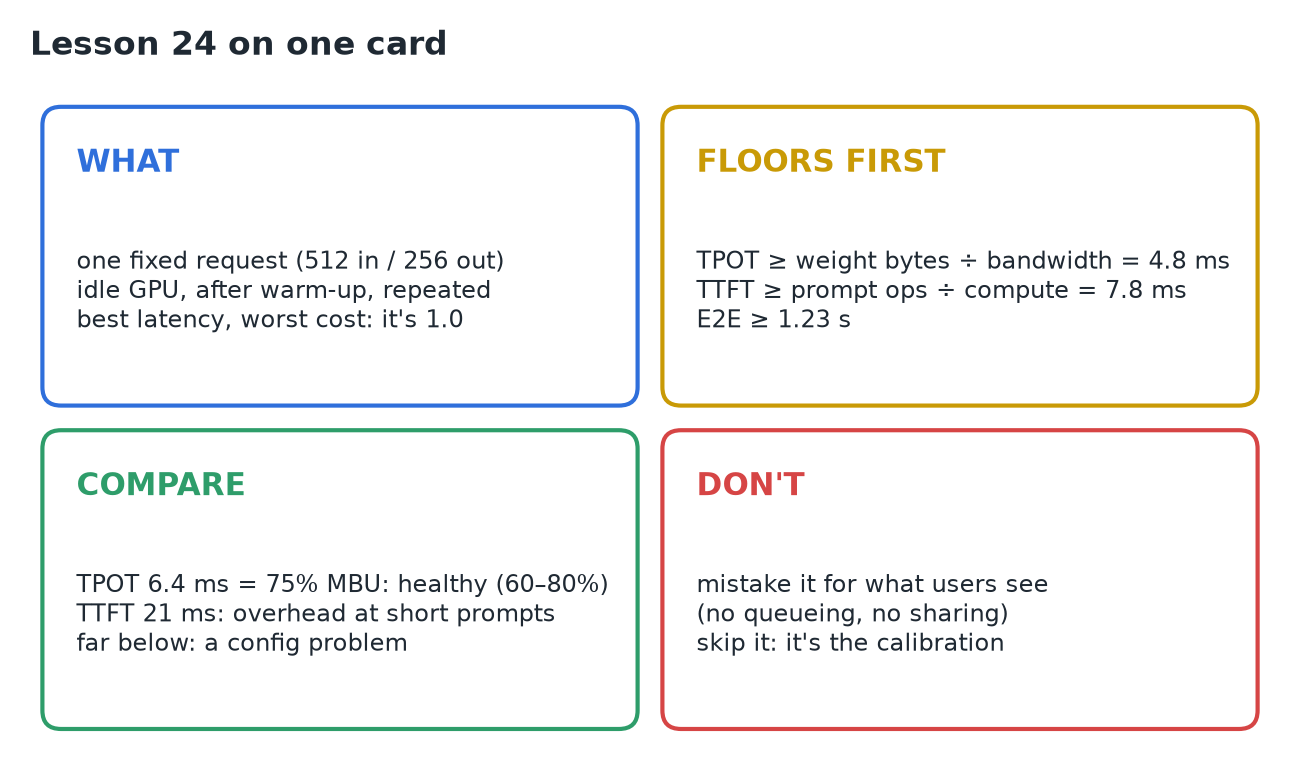
Every later speedup is a ratio against a starting number, so get that number right: one fixed request on an idle GPU (Llama 3 8B, 16-bit, one H100, vLLM; 512 in, 256 out). It's the best latency users will ever get and the worst cost per token. Work out the floors first: TPOT ≥ 16 GB ÷ 3.35 TB/s ≈ 4.8 ms, TTFT ≥ 7.7 TFLOP ÷ 989 TFLOPS ≈ 7.8 ms, E2E ≥ 1.23 s. Measure cleanly (pinned setup, fixed shape, greedy, warm-up, ~30 repeats, batch 1). A clean run (illustrative) gives TTFT 21 ms, TPOT 6.4 ms, E2E 1.65 s: 75% of memory bandwidth, healthy in the 60–80% range. Far worse means a configuration problem, and the floor is what tells you.
1. Why a baseline, and the default trap
vLLM's latency benchmark (vllm bench latency) sends a batch of 8 requests at once by default. That number measures eight requests sharing the GPU and says very little about one. If the starting number is wrong, every ratio after it is wrong too.
The single-request baseline answers one question: when the GPU has nothing else to do, how fast does one request go? Record TTFT, TPOT and E2E.
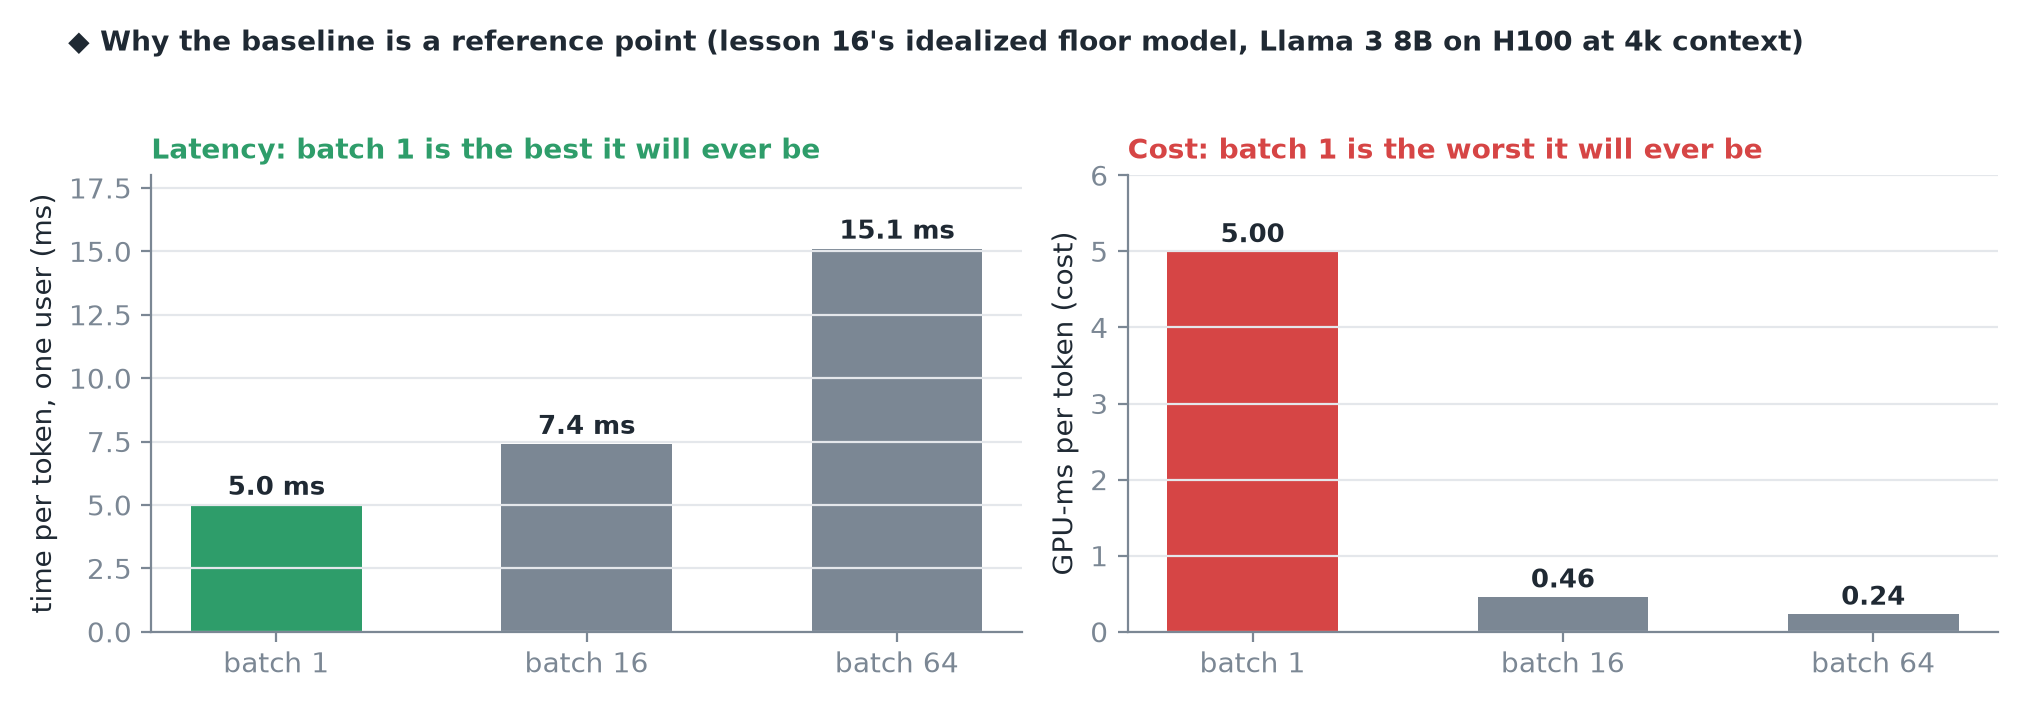 It's the best latency this setup will ever give a user (nobody competes for the GPU) and the worst cost per token (the GPU does the least useful work it can). Both make it a reference point.
2. Work out the floors first
- Decode: each step reads all ~16 GB of weights; 16 GB ÷ 3.35 TB/s ≈ 4.8 ms per token. No implementation goes below it: the bytes can't arrive faster.
- Prefill: 512 tokens × ~15 GFLOP each ≈ 7.7 TFLOP; ÷ 989 TFLOPS (16-bit) ≈ 7.8 ms to the first token.
- End to end: 7.8 ms + 255 × 4.8 ms ≈ 1.23 s.
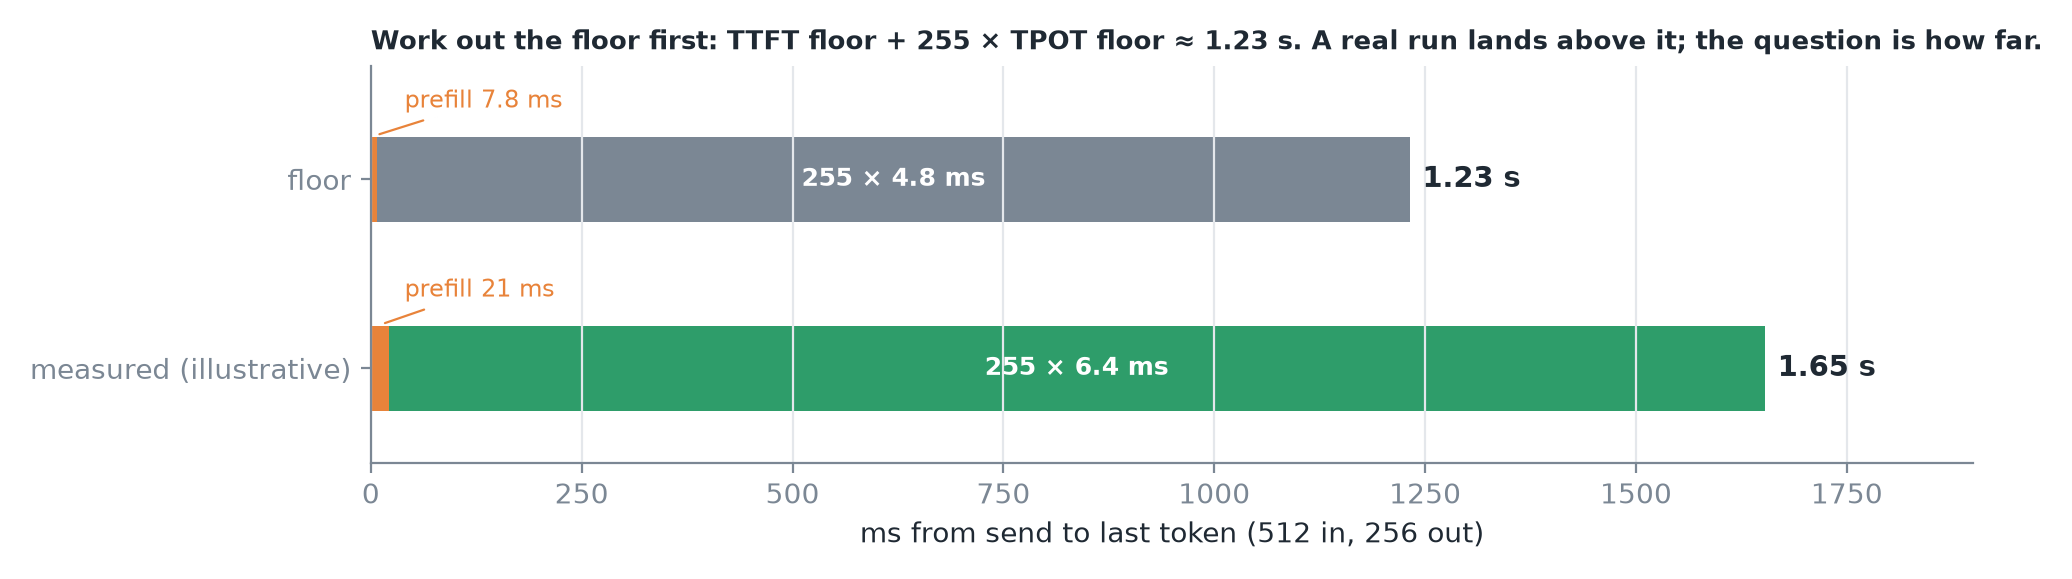 The floor and an illustrative clean run on the same axis. 255, not 256: the first token's time is TTFT.
3. Measure cleanly
Remove everything that isn't the thing you're measuring.
| Rule | Why |
|---|---|
| Pin the setup: model revision, dtype, engine version, GPU, driver | Someone else can reproduce it |
| Fix the shape: exactly 512 in, force 256 out (ignore EOS) | Otherwise one run stops at 40 tokens and another at 200 |
| Greedy decoding | Same output every run |
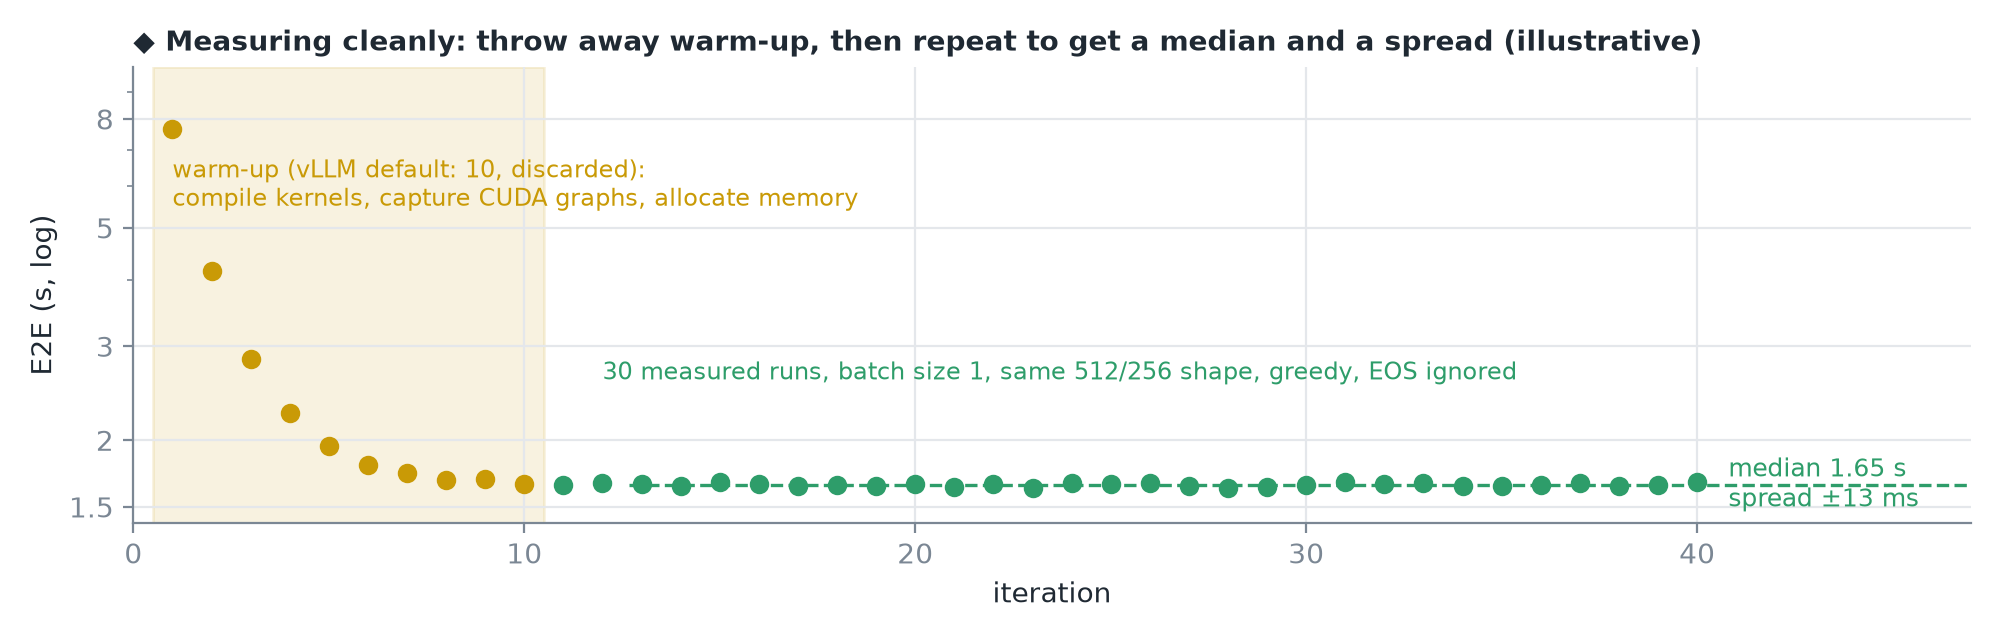
| Warm up (vLLM: 10 iterations, discarded) | First requests pay one-time costs: kernel compiles, CUDA graph capture, memory allocation |
| Repeat ~30 times | One run says almost nothing; 30 give a median and spread |
| Batch size 1 | The whole point |
Run it two ways:
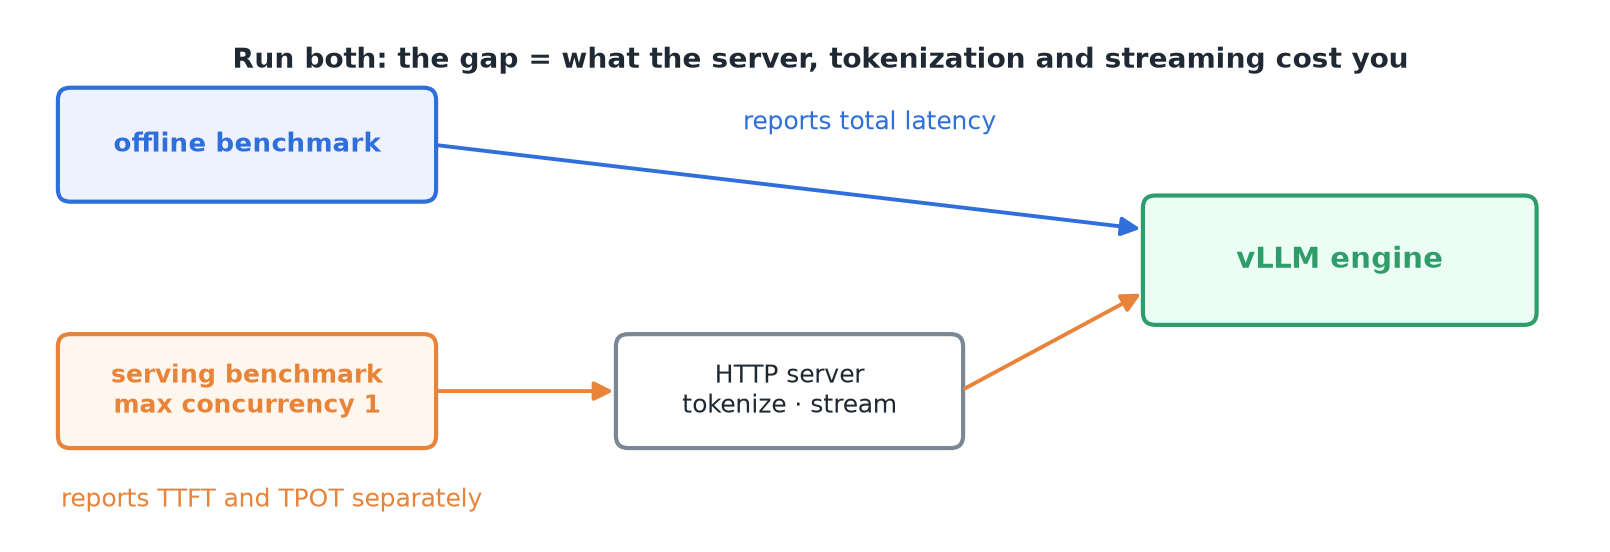 The offline benchmark talks to the engine directly and reports total latency. The serving benchmark goes through the real HTTP server at max concurrency 1 and reports TTFT and TPOT separately.
4. Compare against the floors
A clean run (illustrative numbers, in the expected range): TTFT 21 ms, TPOT 6.4 ms, E2E ≈ 1.65 s.
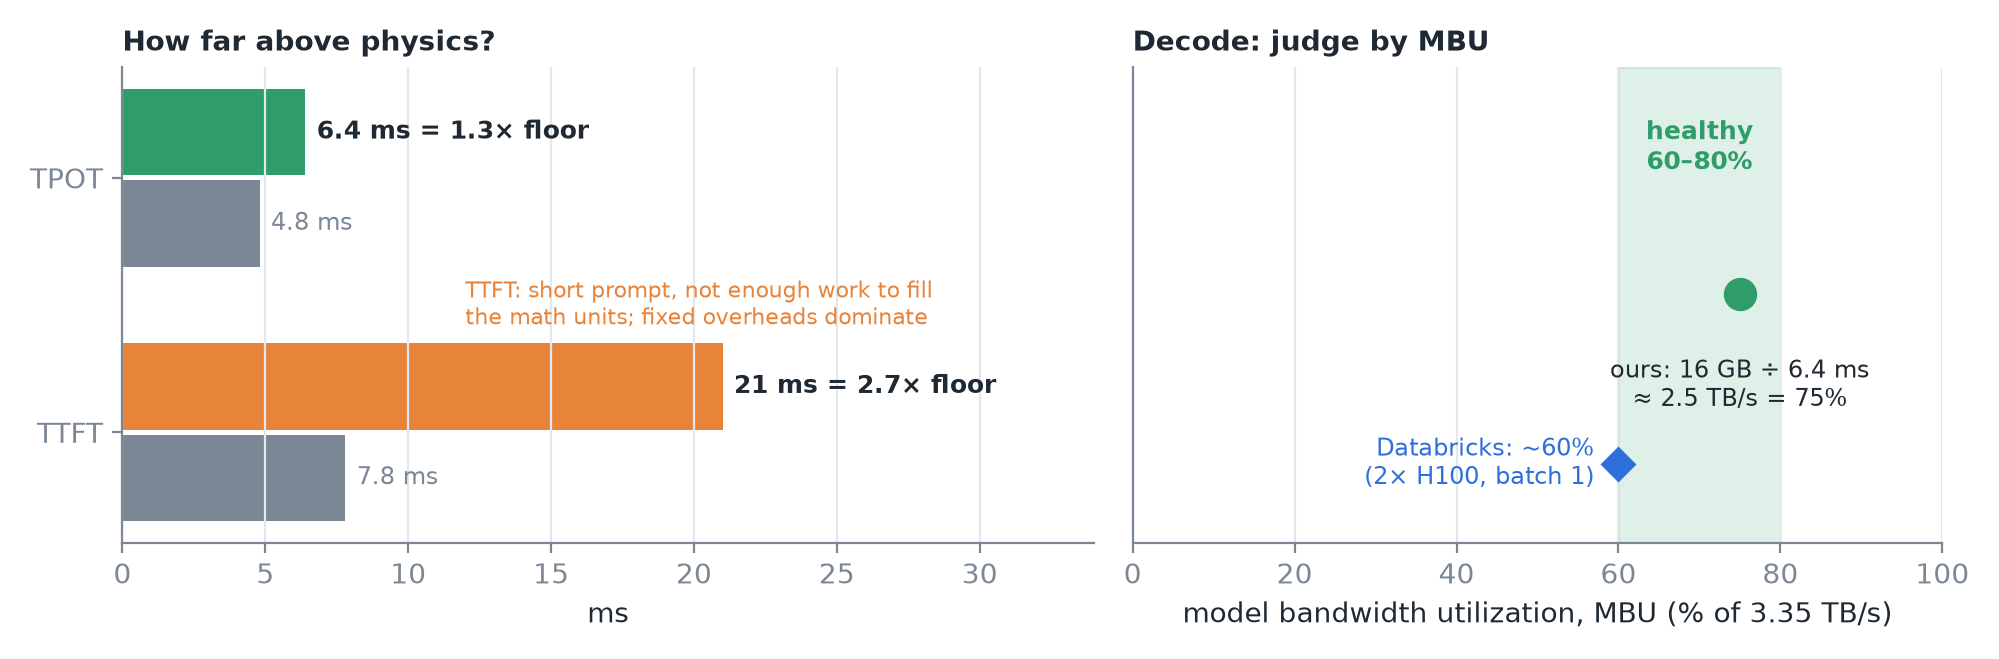 Decode: 16 GB every 6.4 ms ≈ 2.5 TB/s, 75% of peak. Databricks calls this model bandwidth utilization (MBU) and reported about 60% at batch 1 on two H100s.
- Decode at 60–80% MBU means the engine is doing its job.
- Prefill sits further from its floor (21 vs 7.8 ms). Normal for a short prompt: 500 tokens isn't enough work to keep every math unit busy, and fixed overheads matter more.
5. When it looks off
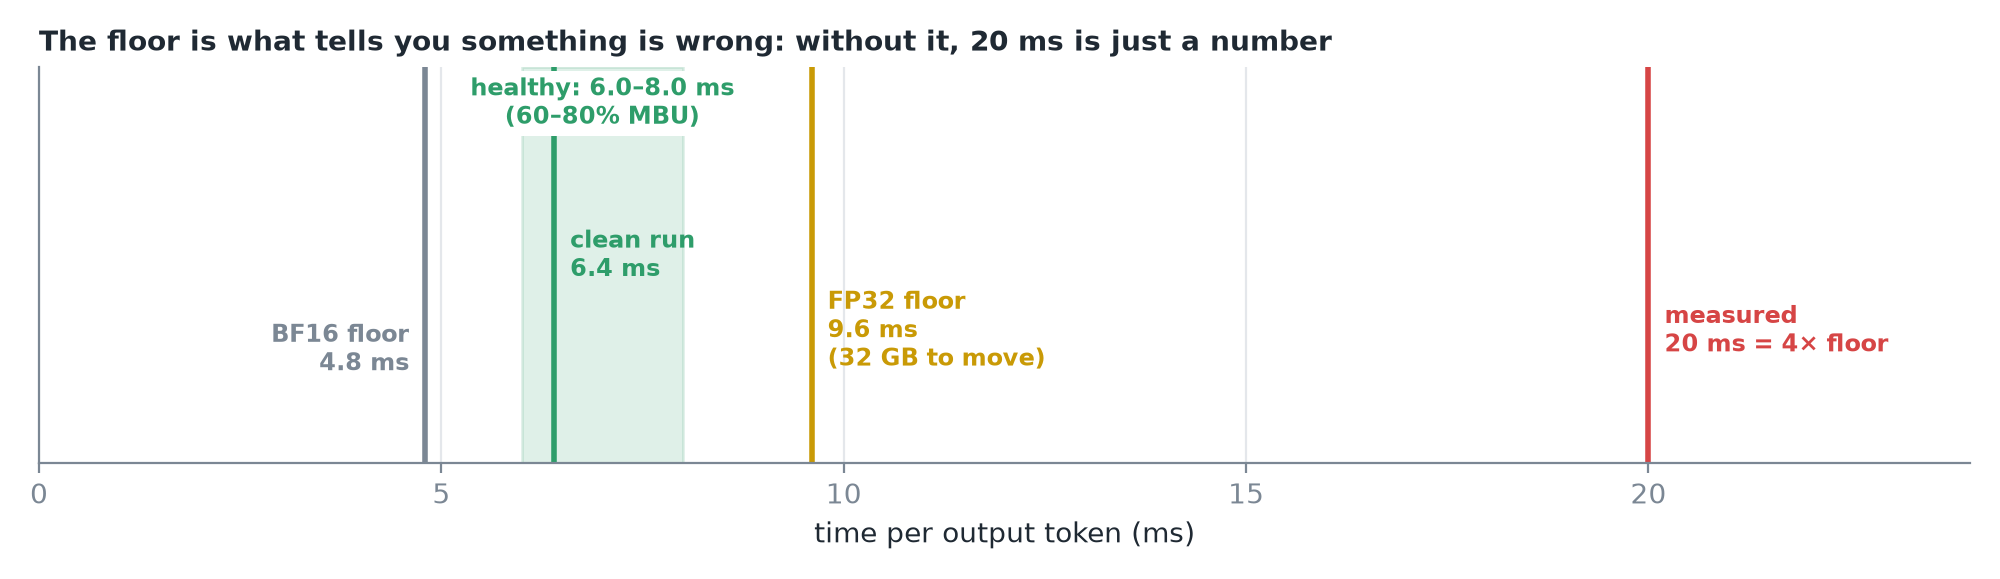 Say TPOT is 20 ms, about 4× the floor. That's a symptom.
| Suspect | What happens |
|---|---|
Eager mode (--enforce-eager) | No CUDA graphs or compilation: the CPU launches every small GPU op one by one, every step |
| FP32 weights | 32 GB to move: the floor itself doubles to 9.6 ms |
| A noisy GPU | Another process, a leftover notebook, or clocks throttled by power or heat |
| TTFT is the odd one out | Skipped warm-up, or the client also times network and tokenization |
| Wide spread between runs | Trust none of the numbers until you know why |
6. Write it down
| Field | Example |
|---|---|
| Setup | Model revision, dtype, engine, driver |
| Shape | 512 in / 256 out, greedy, ignore EOS |
| Metrics (median and spread) | TTFT 21 ms · TPOT 6.4 ms · E2E 1.65 s |
| Versus floors | TPOT 1.3× floor · MBU 75% |
| Conclusion | "Decode runs at 75% of memory bandwidth; prefill is overhead-bound at this prompt length." |
From now on this is 1.0: every later sweep (more users, longer prompts, longer outputs) is a change from here.
CAUTION
Two misunderstandings. The baseline isn't what users see: it's the best case; production adds queueing, sharing and batching. And don't skip it: it's the calibration, and the only measurement you can check against physics.
7. Recap