06 · Probability, Sampling & Benchmark Statistics
Source: fanout.sh / inference-eng / 00-04 · ~8 min
NOTE
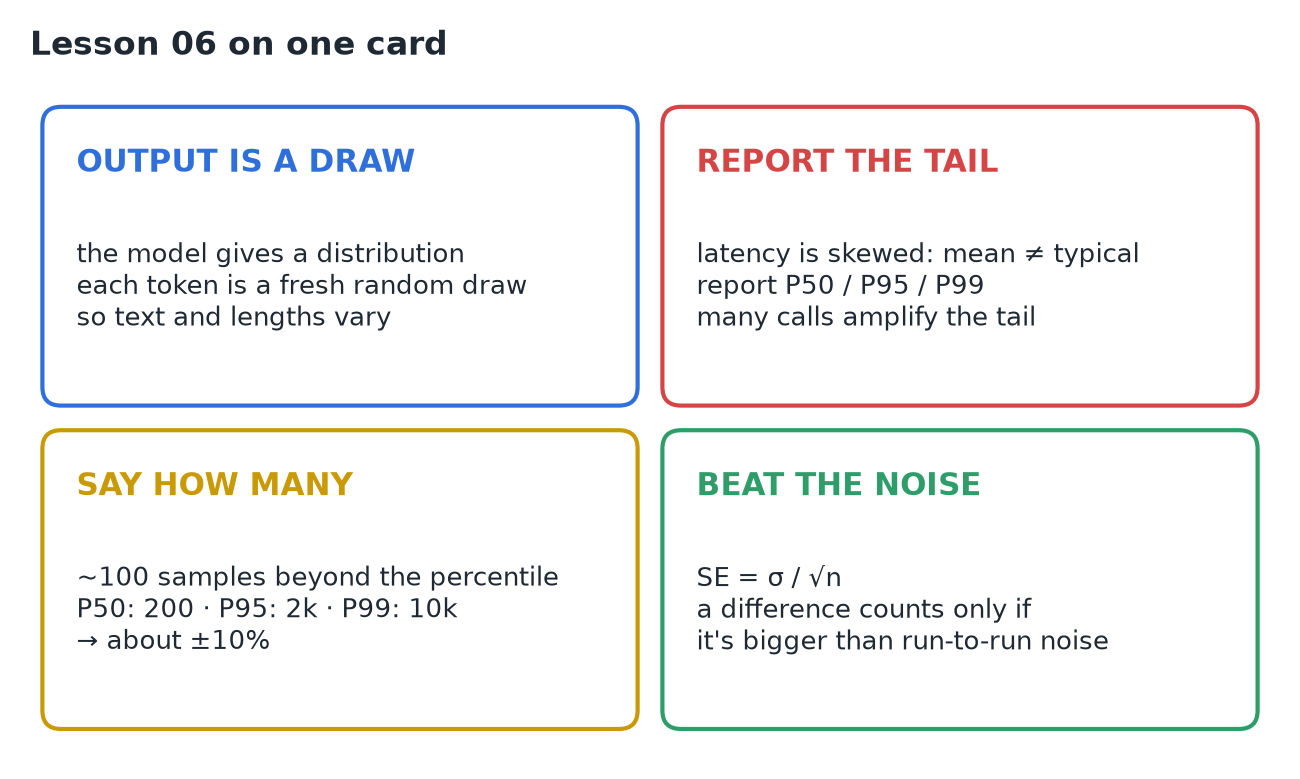
A model's output is a random draw from a probability distribution, so the same prompt gives different text and different lengths. That makes request latency a skewed distribution with a long tail: report P50 / P95 / P99, not just the mean. Tail percentiles need many samples, so always say how many. And a measured difference only counts if it's bigger than run-to-run noise.
Two puzzles share one root, randomness: a benchmark gives 41.6 tok/s, then 42.4 tok/s after a settings change (faster?), and asking the model the same question twice gives two different answers.
1. Distributions and sampling
- Given "the sky is", the model outputs a probability for every possible next token: blue 62%, clear 14%, dark 8%, everything else 16%. Each outcome gets a number in [0, 1] and they sum to exactly 1.
- Sampling = one random draw. Lay the probabilities end to end on a 0–1 line, pick a uniform random point; the stretch it lands in is the token.
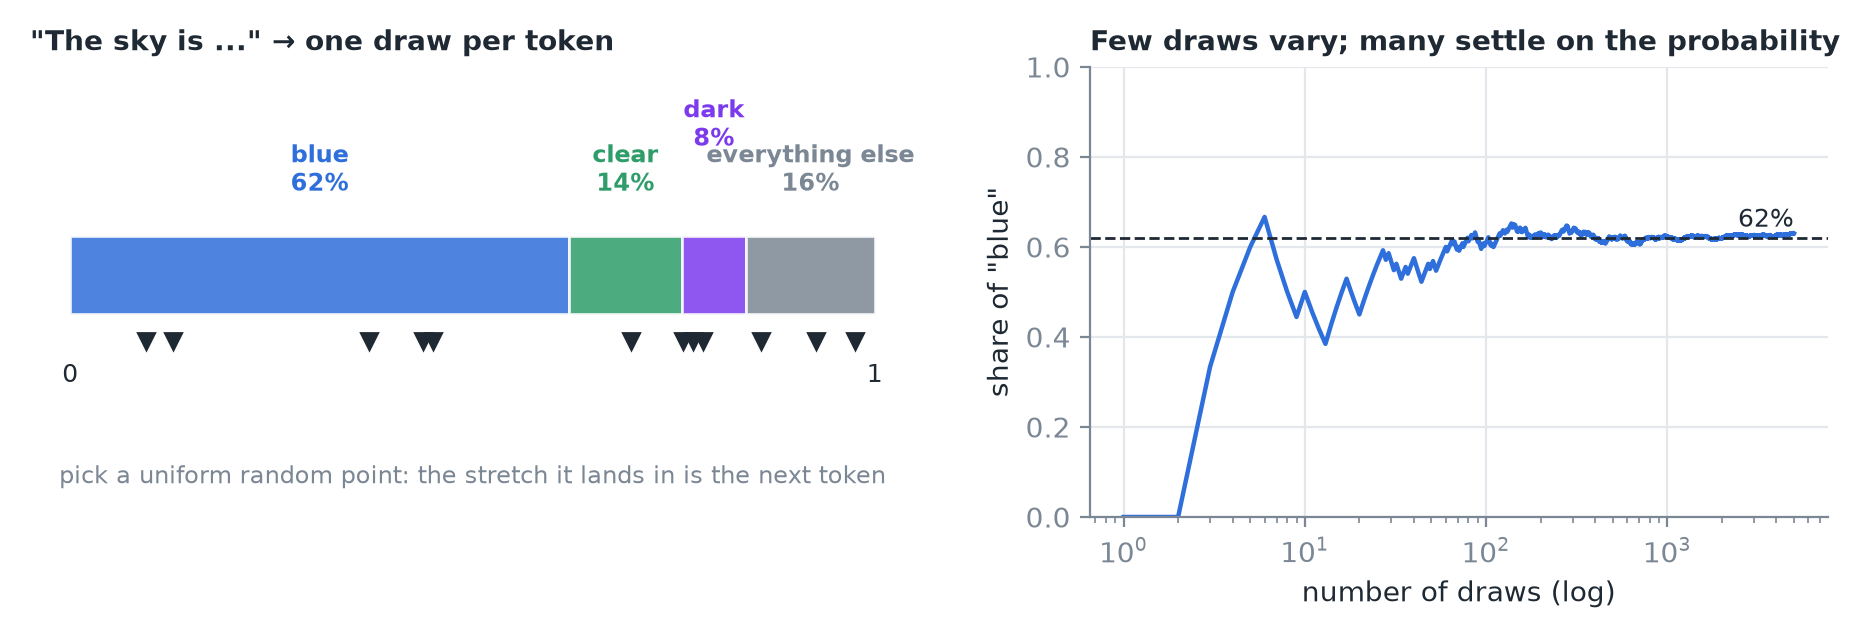 Left: each token owns a stretch of the 0–1 line. Right: over a few draws "blue" wanders; over thousands it settles on 62%.
IMPORTANT
Every token is a fresh draw. That's why the same prompt can give different answers.
2. Randomness leaks into performance
A reply ends when the model draws the end-of-text token. A small chance of that at every step means some replies stop after 40 tokens and others run to 400. Each decode step costs about the same time, so reply length decides request time.
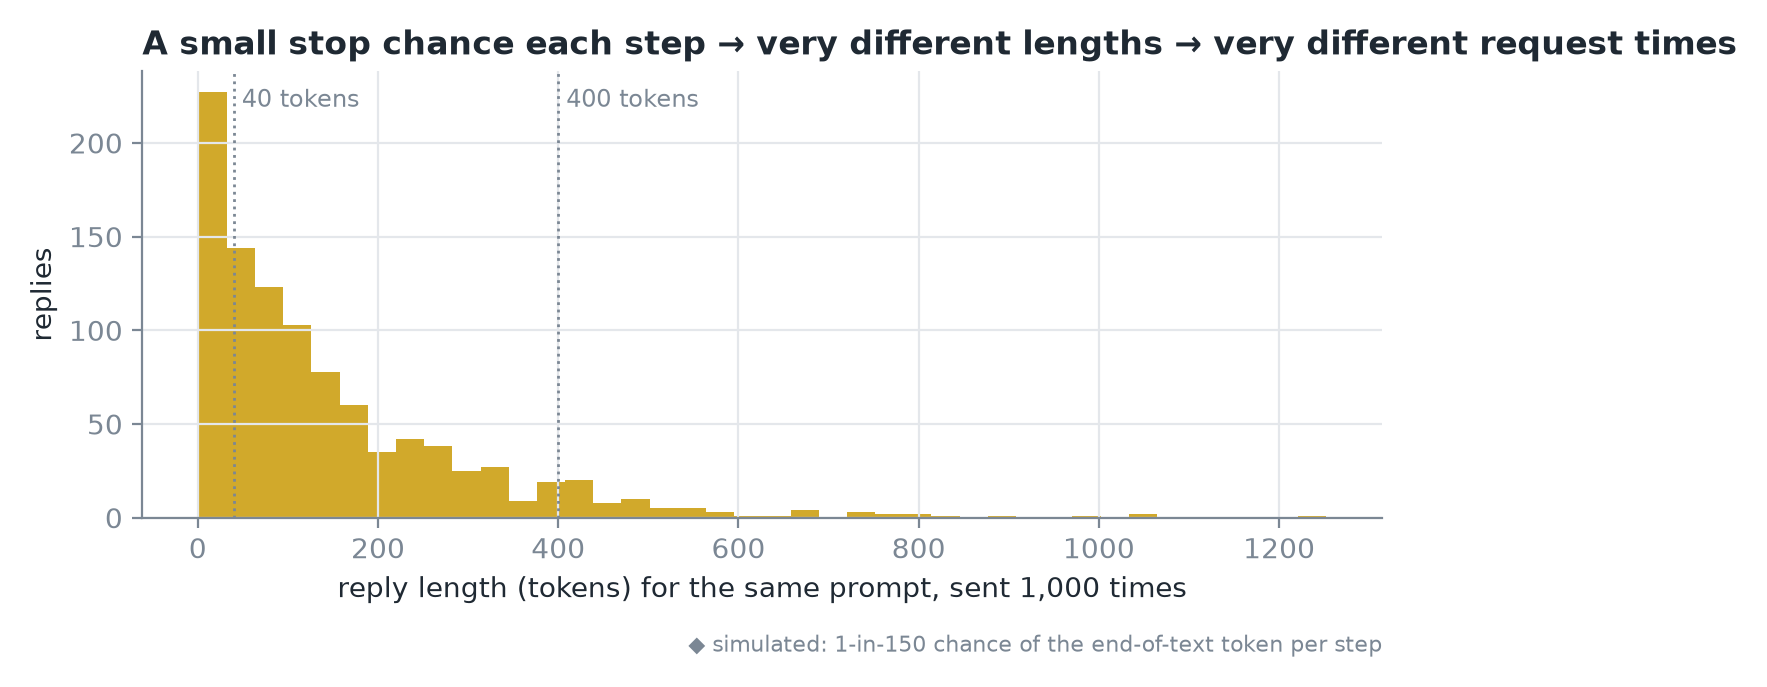 Simulated: the same prompt sent 1,000 times gives a wide spread of reply lengths.
So a benchmark never measures one latency; it measures a distribution of latencies.
3. Mean, median and the tail
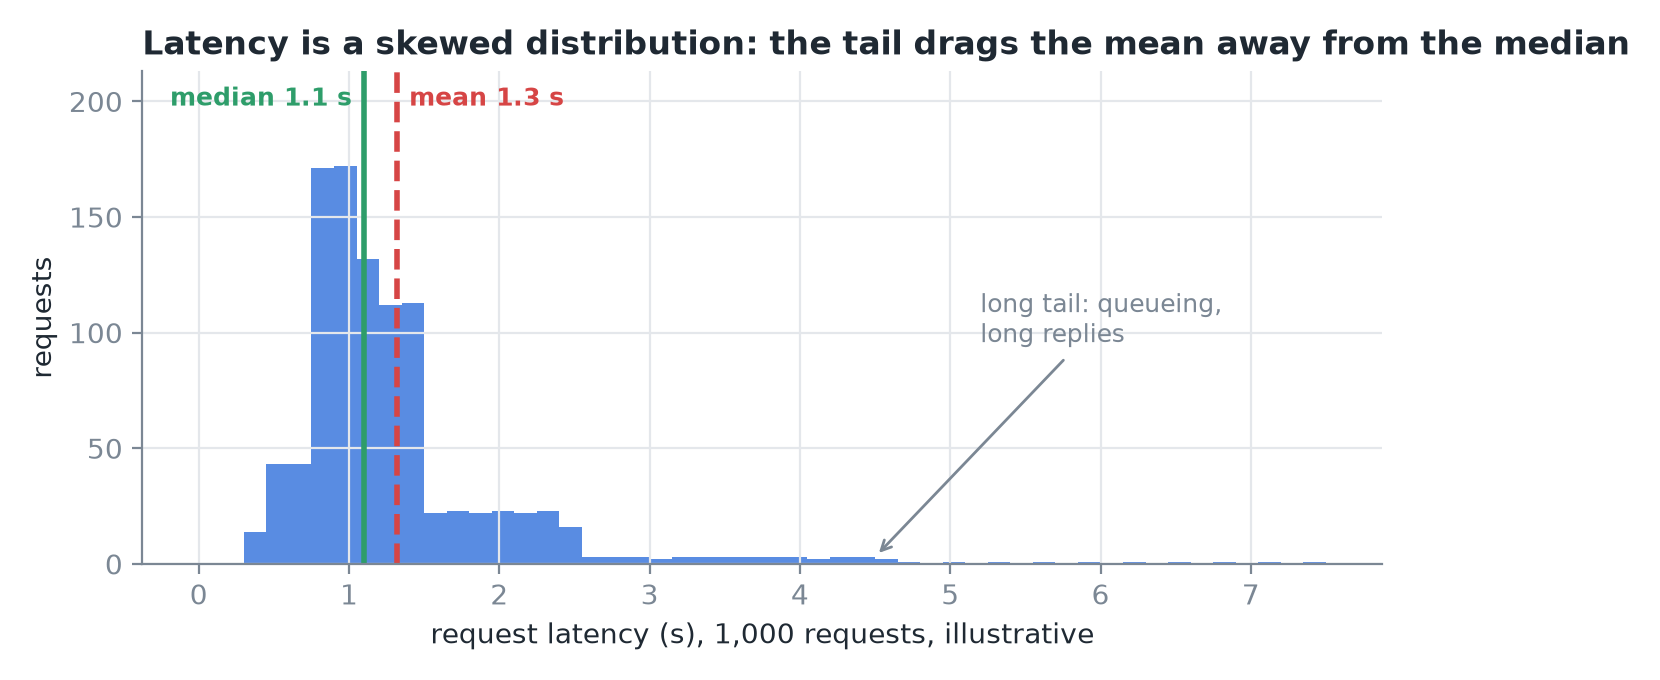 1,000 requests (illustrative): most near 1 s, but queueing and long replies stretch a tail to the right.
| Summary | How | Here | Use |
|---|---|---|---|
| Mean | Sum ÷ count | 1.3 s (dragged right by the tail) | Describes almost nobody when the tail is long |
| Median (P50) | Middle request: half faster, half slower | 1.1 s | The typical request |
The tail, the slowest requests, is exactly what users complain about.
4. Percentiles describe the tail
Sort the 1,000 latencies. P50 is the value at position 500, P95 at 950 (95% are faster), P99 at 990 (only 1 in 100 is slower).
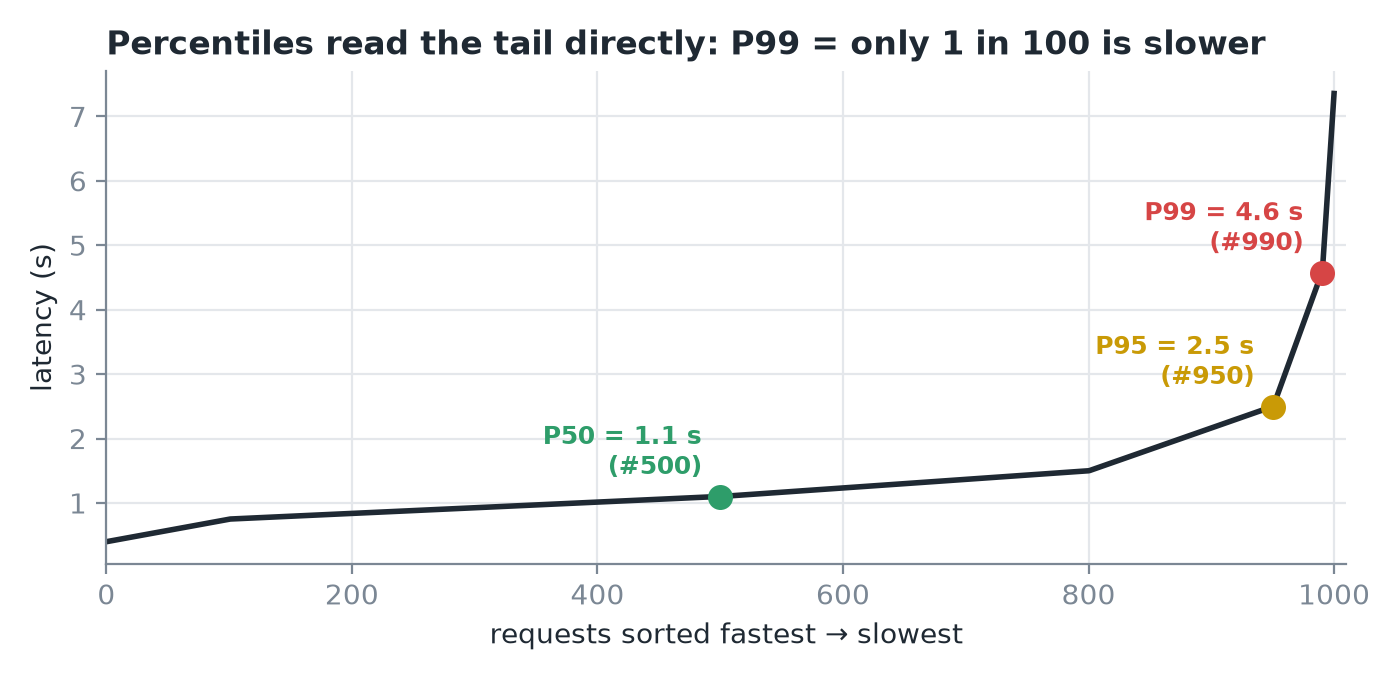 Here P50 = 1.1 s, P95 = 2.5 s, P99 = 4.6 s.
Why care about 1 in 100? Real pages and agents make many calls per user action:
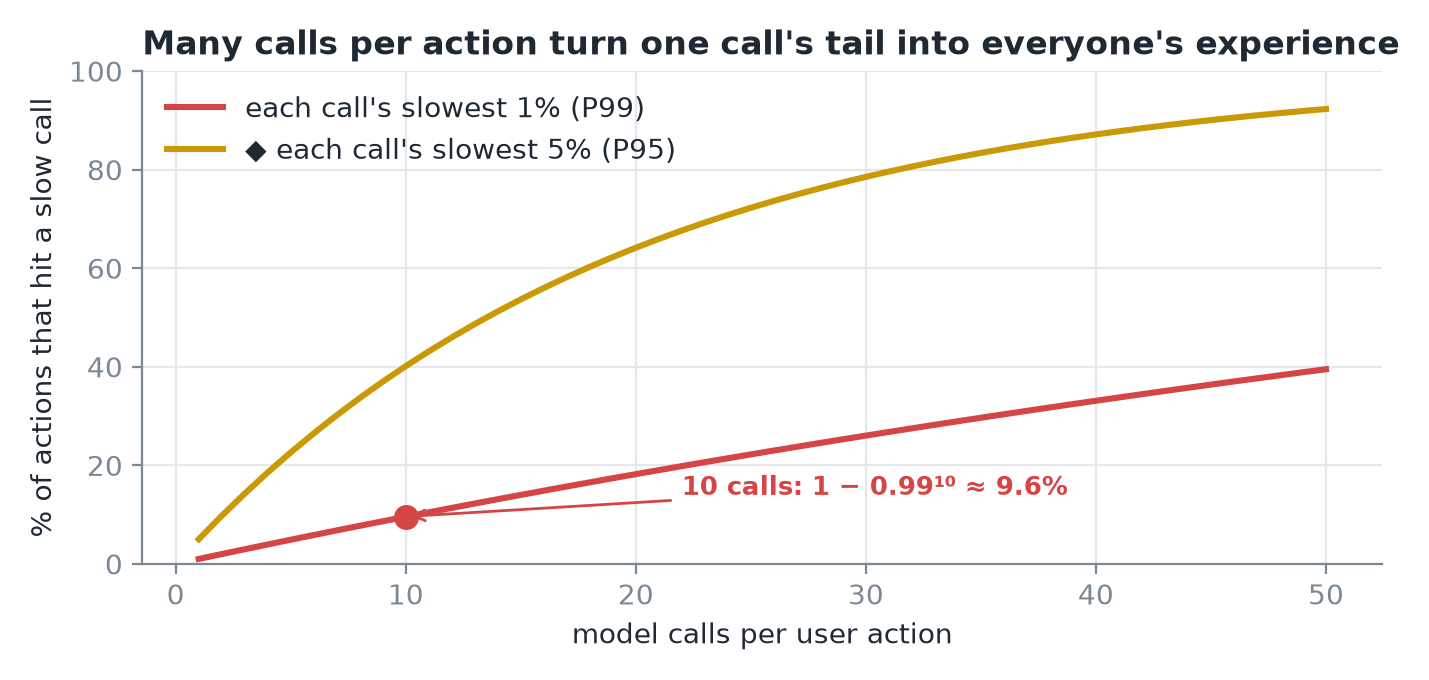 The more calls per action, the more often someone hits a slow one.
IMPORTANT
The tail of each call becomes the typical experience of the whole task. That's why serving targets are percentiles, e.g. P99 time to first token < 2 s.
5. How many samples does a percentile need?
With only 100 requests, P99 is the value at position 99, decided by the single slowest request. Rerun the test and that one request changes, so P99 jumps around.
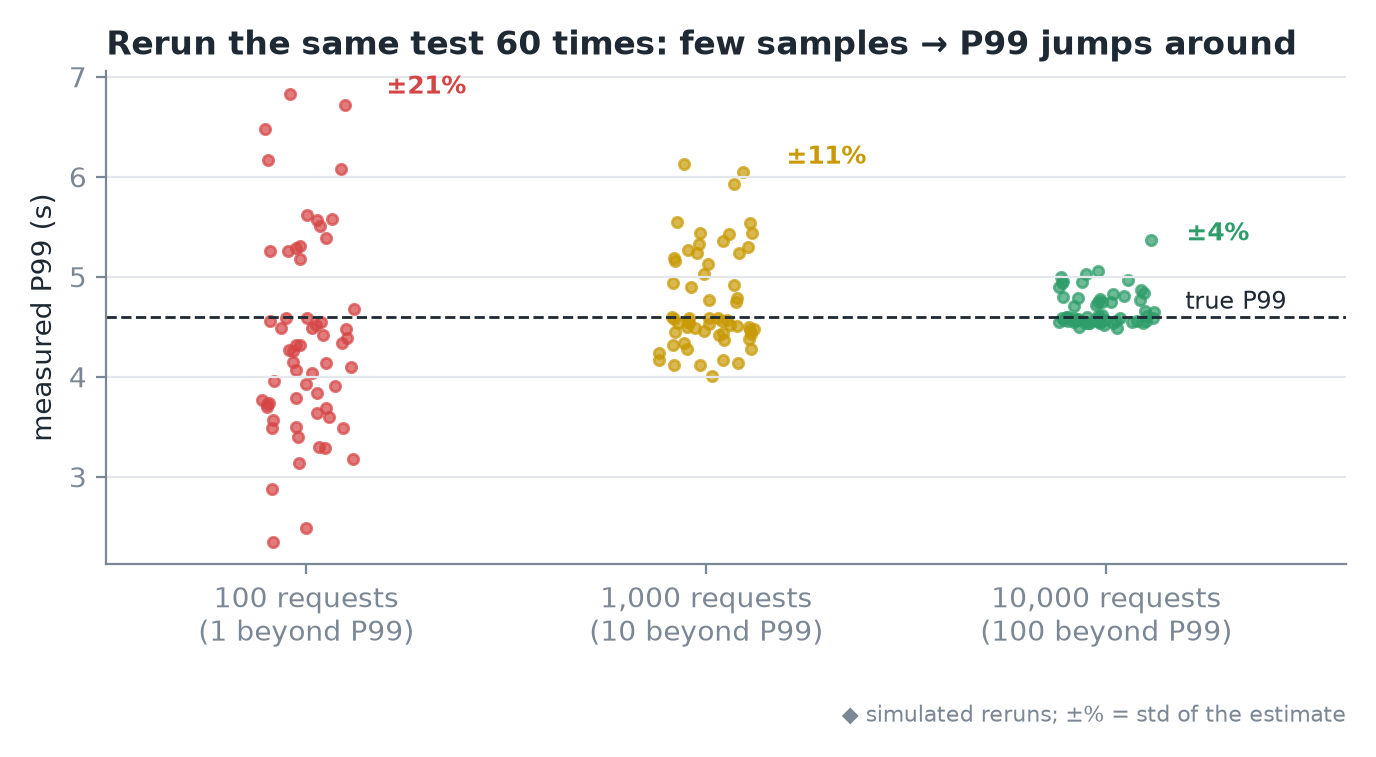 Simulated reruns: P99 from 100 requests swings widely; from 10,000 it barely moves.
Rule of thumb: about 100 samples beyond the percentile you report gives an estimate steady to about 1/√100 = 10%.
| Report | Fraction beyond | Requests needed |
|---|---|---|
| P50 (median) | 50% | 200 |
| P95 | 5% | 2,000 |
| P99 | 1% | 10,000 |
TIP
Whenever you see a P99, ask: out of how many requests?
6. Real speedup, or noise?
Back to 41.6 vs 42.4 tok/s. The honest move: run each setting several times. Five runs each: A lands from ~40.5 to nearly 43, B from ~41.5 to 43. The ranges overlap heavily.
- Standard deviation (spread of runs): σ ≈ 0.8 tok/s.
- Standard error of an average shrinks with √n: SE = σ/√n = 0.8/√5 ≈ 0.4.
- For the difference of the two averages, the noise band is about ±1 tok/s. The observed difference is only 0.7, inside the noise.
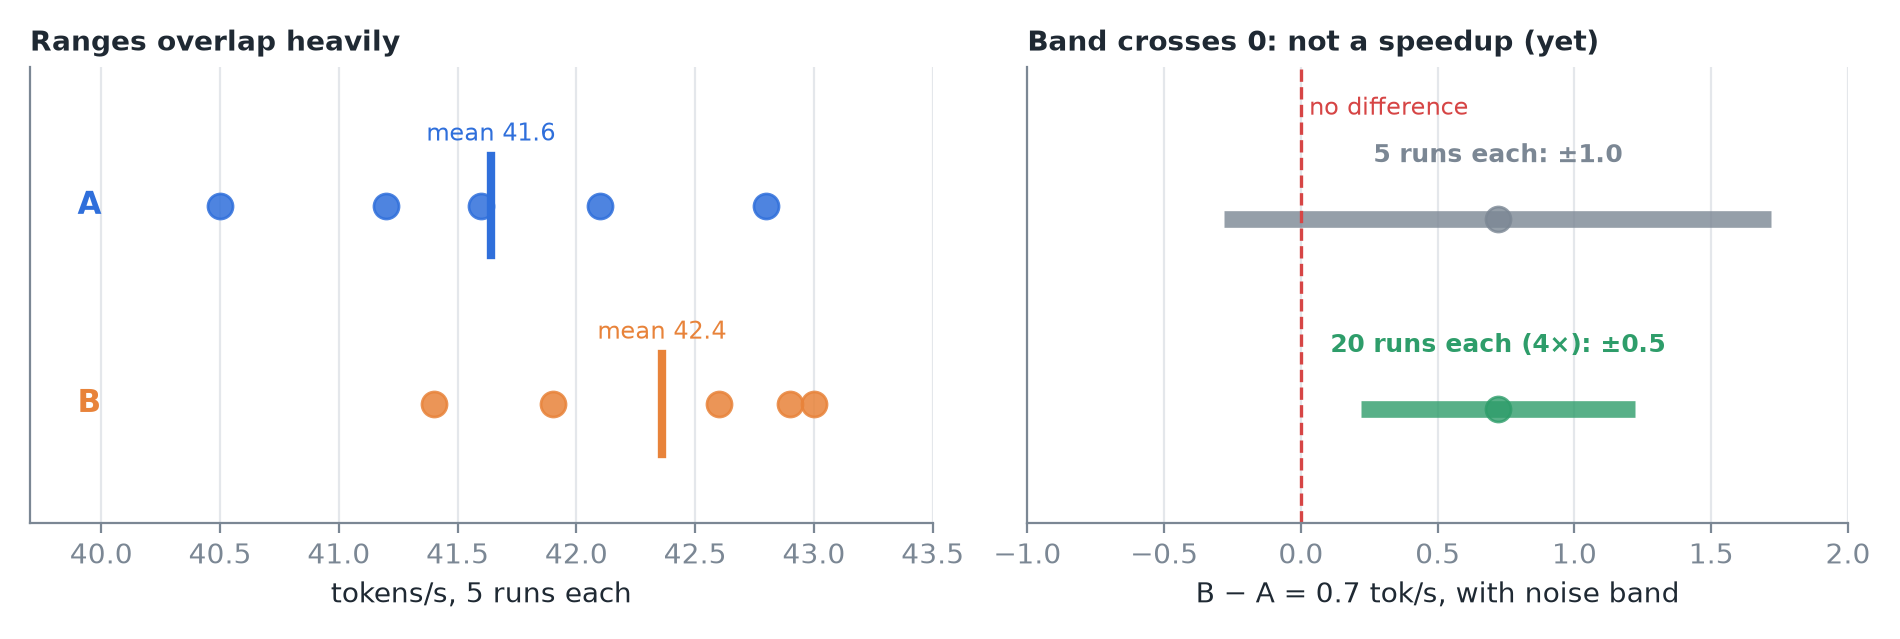 With 5 runs each the band crosses zero: can't claim B is faster. 4× the runs halves the band; if the 0.7 held up, it would clear zero.
IMPORTANT
Before calling something a speedup, compare it to the run-to-run noise.
7. Recap