54 · Measure Quality Regression
Source: fanout.sh / inference-eng / 11-07 · ~7 min
NOTE
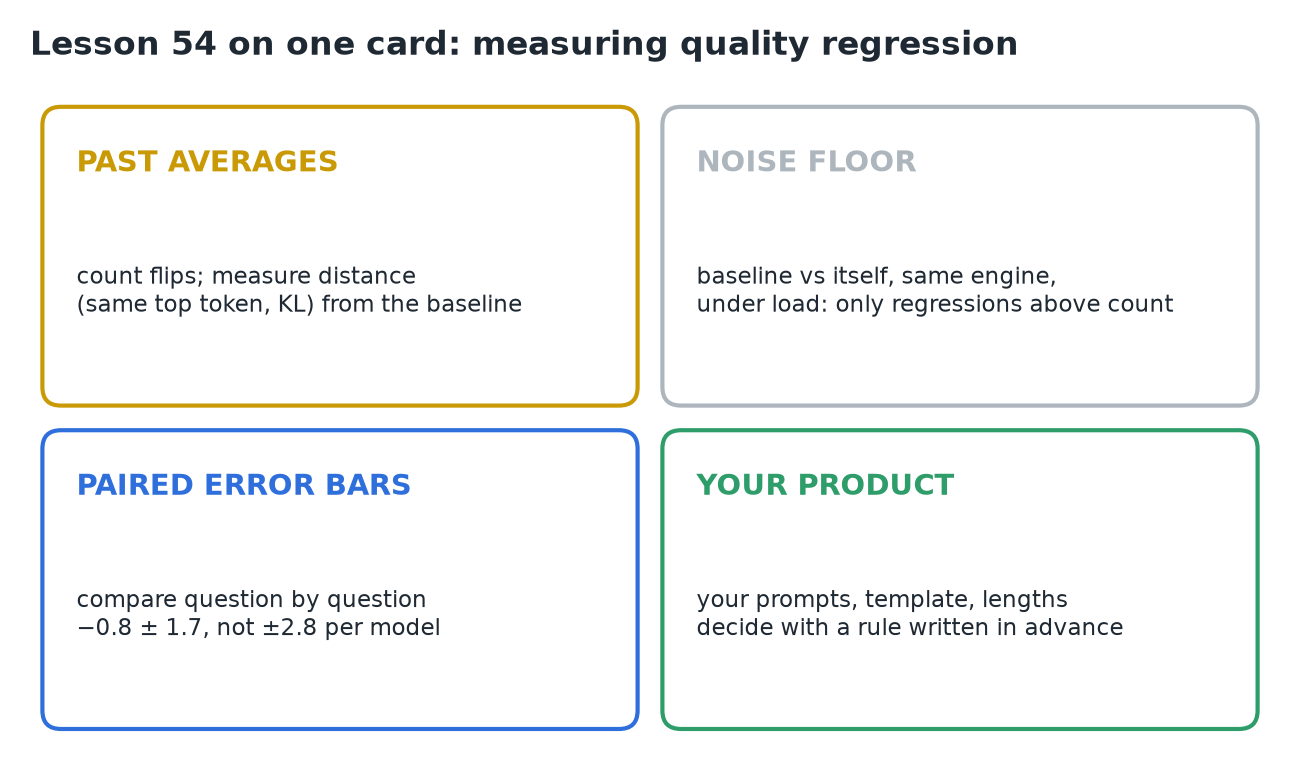
A 4-bit model can be ≈ 2.5× faster for one user with weights under ⅓ of the memory, while its benchmark score drops only 72.0% → 71.2%. The score alone can't tell you whether it got worse: averages hide flips (answers that changed), and the original model is noisy by itself. Climb a ladder of four checks: distance from the original, flips against the noise floor, paired accuracy with error bars, and your own product prompts. Then decide with a rule written before the run.
1. The trap inside averages
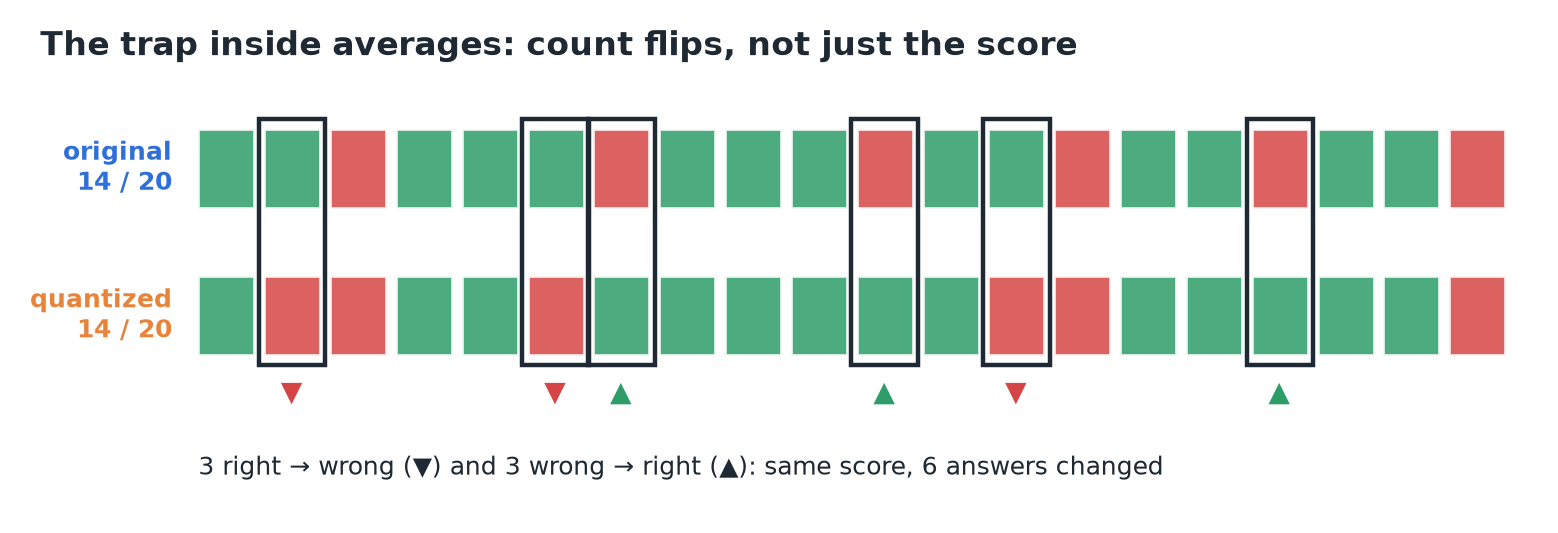 Twenty questions, my own arrangement of the lesson's counts.
- Both models score 14 / 20, yet 3 answers went right → wrong and 3 went wrong → right: 6 of 20 changed.
- Dutta et al., Microsoft Research (NeurIPS 2024): across quantized models, accuracy changed by ≤ 2% while flips reached 13.6%.
- Models with more flips were judged worse in open-ended conversation, even when their benchmark scores matched.
2. The ladder
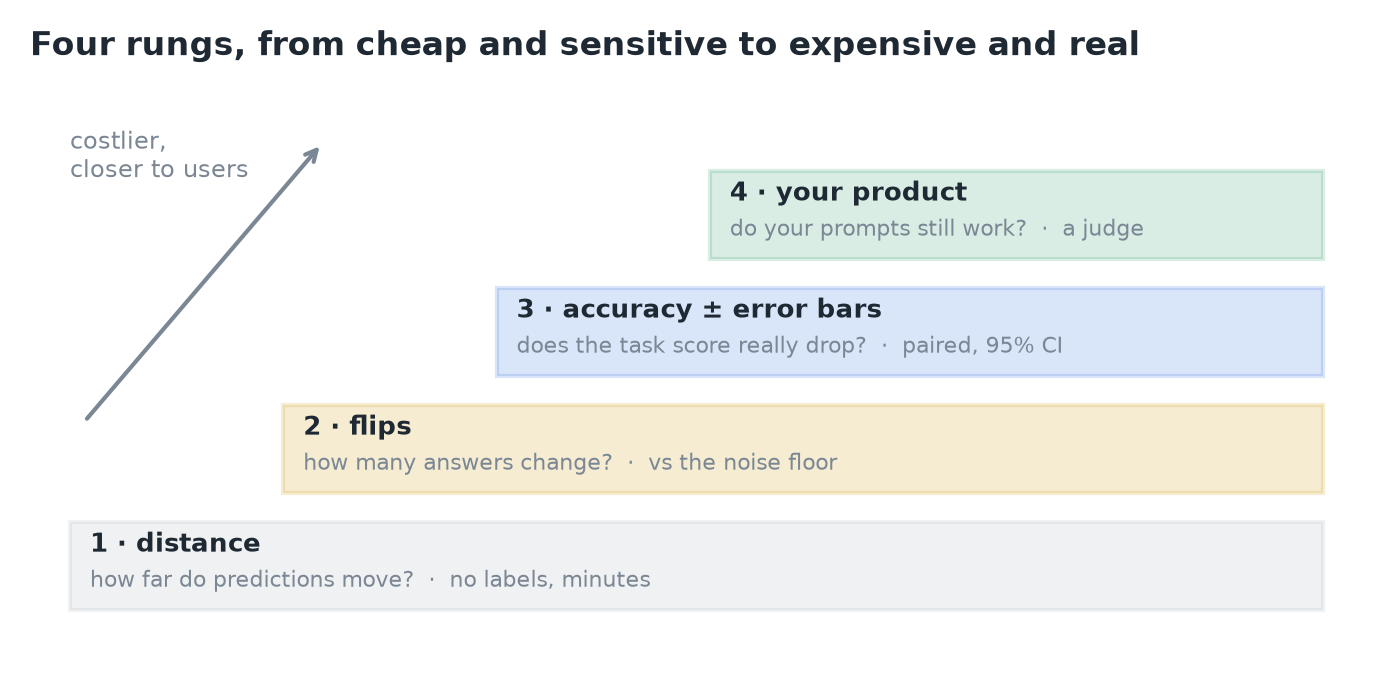 Each rung costs more and sits closer to real users.
- Distance: how far do the predictions move from the original?
- Flips: how many answers change, compared with the noise floor?
- Accuracy with error bars: does the task score really drop?
- Your product: do your own prompts still work?
3. Rung 1: distance
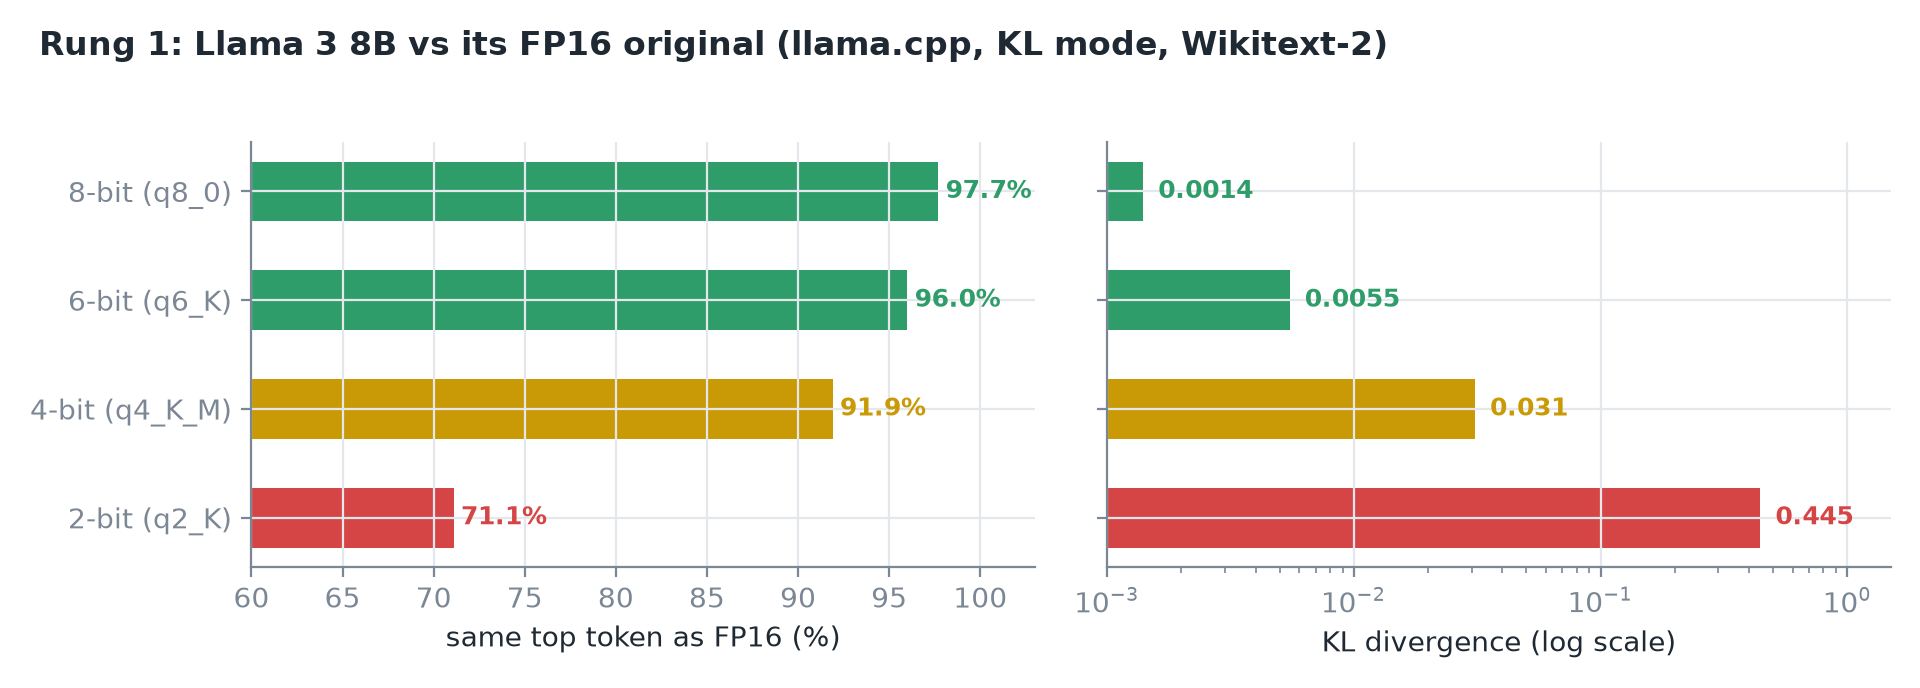 llama.cpp KL-divergence mode, Llama 3 8B against FP16 on Wikitext-2.
- Run the original and the quantized model on the same text and compare, token by token:
- how often they pick the same top token;
- the KL divergence between their probability distributions.
- It needs no labels and runs in minutes, so it's great for catching bugs (a broken conversion shows up as a huge KL).
- 4-bit (q4_K_M) keeps the same top token 91.9% of the time; 2-bit falls to 71.1%, with a KL ≈ 14× larger.
- The limit: it measures distance, not harm. A changed token can be an equally good answer.
4. The noise floor
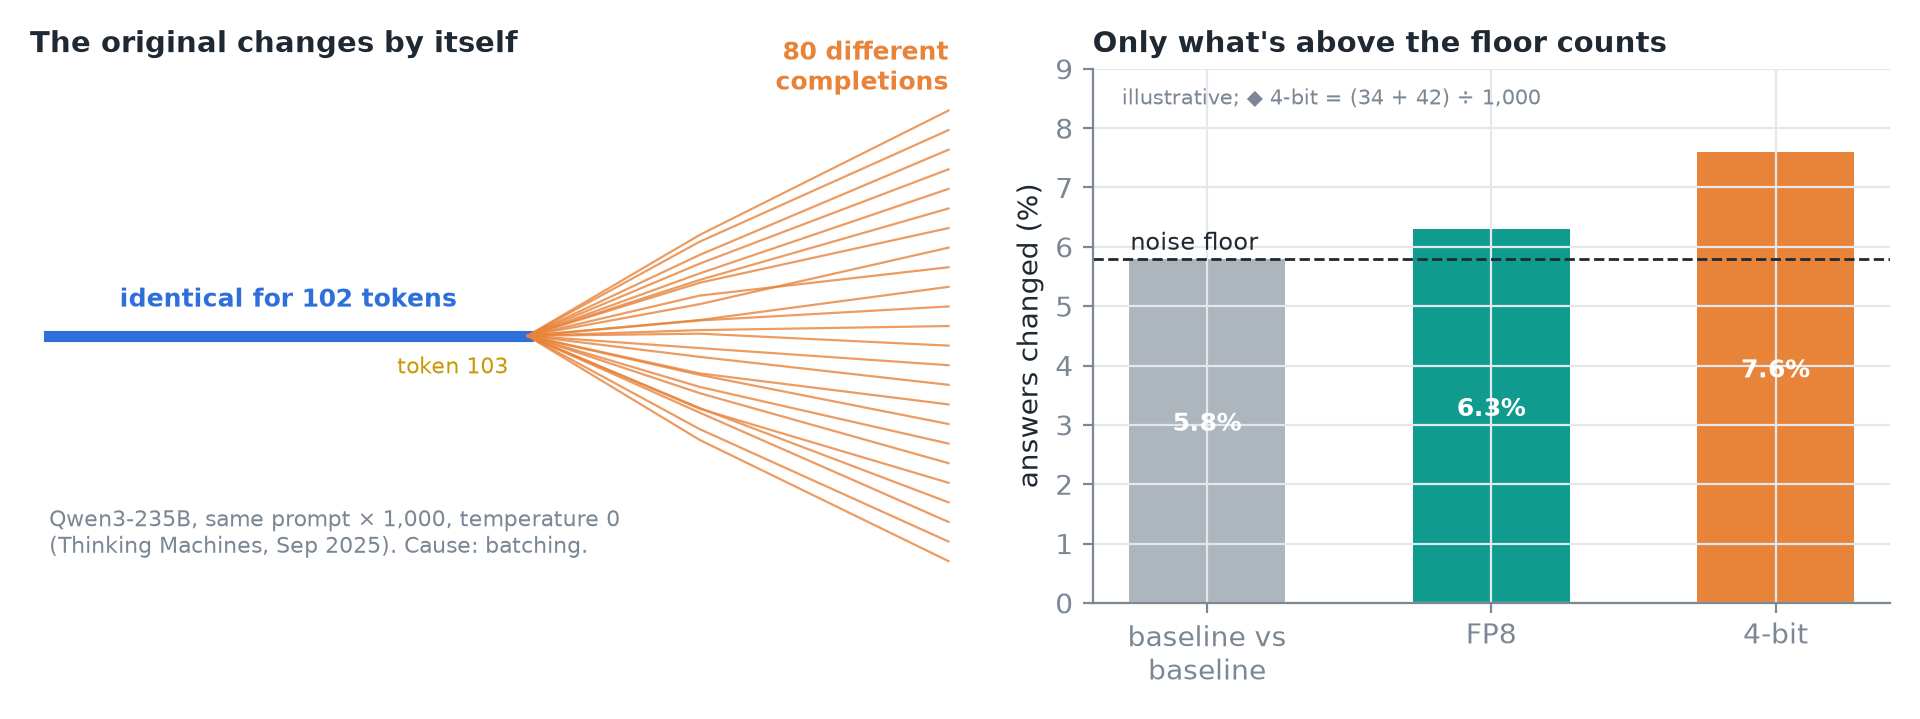 Right panel: illustrative flip rates. ◆ I set the 4-bit bar to 7.6% so it matches the paired example below.
- First ask how much the original changes by itself:
- BF16 vs FP16, same weights, disagree on the top token ≈ 0.26% of the time.
- Thinking Machines (Sep 2025): Qwen3-235B, the same prompt 1,000 times at temperature 0, gave 80 different completions. All were identical for 102 tokens, then split at token 103.
- The cause is batching: a different batch size means slightly different arithmetic, so the results can differ.
- So measure the floor by running the baseline against itself, in the same engine, under load. Only flips above the floor count against the quantized model.
5. Rung 3: accuracy with error bars
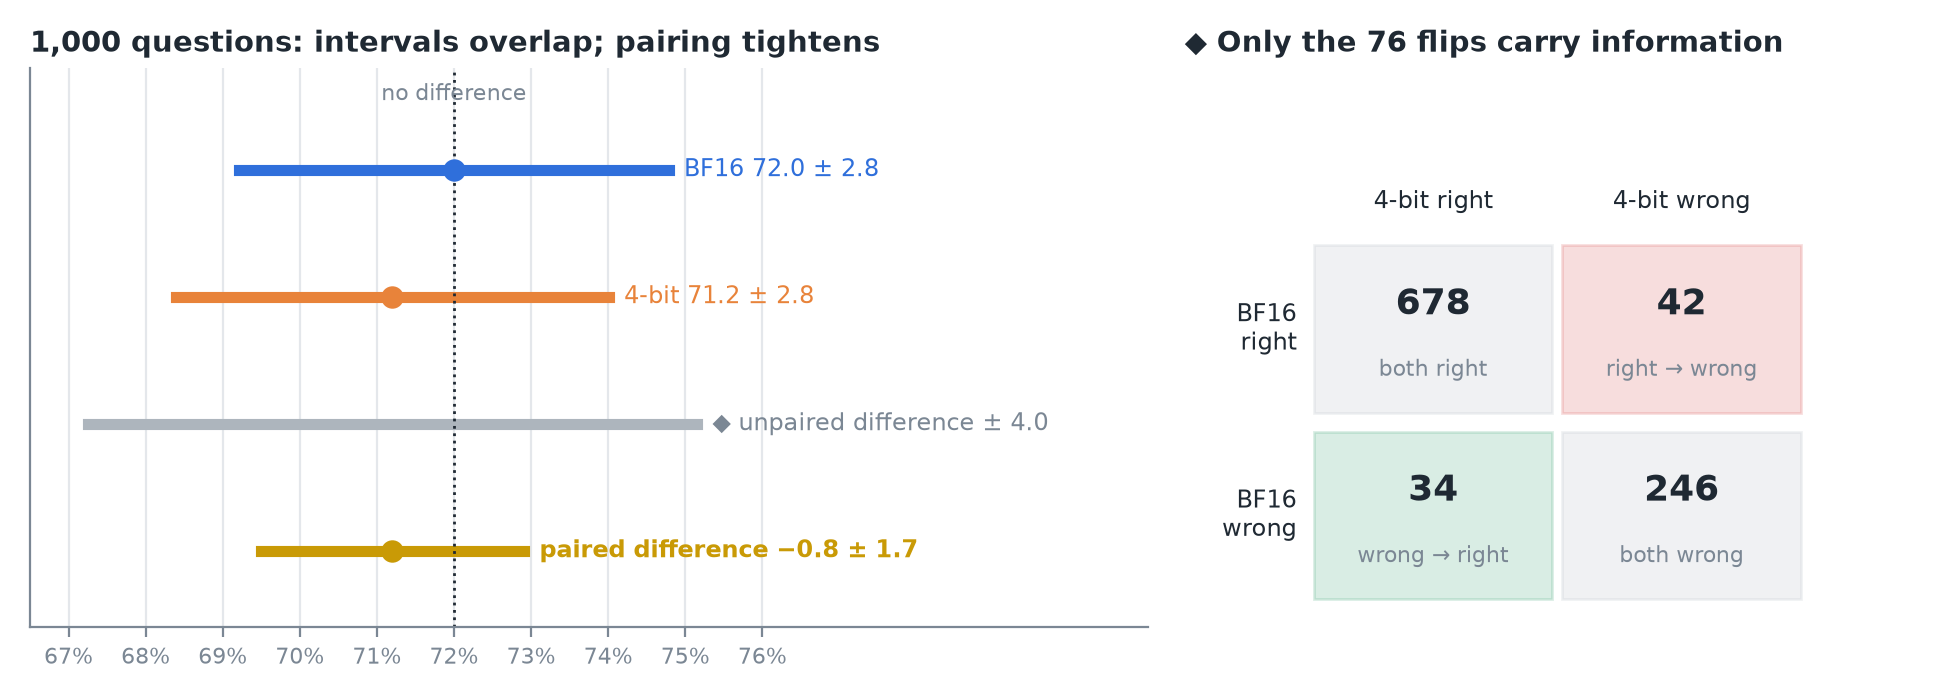 Scores are the lesson's illustrative numbers; the arithmetic is real. ◆ The 2×2 table and the unpaired-difference bar are mine.
- On 1,000 questions at ≈ 70%, each score has a 95% interval of about ±2.8 points. The two intervals overlap almost completely, which says little.
- Both models answered the same 1,000 questions, so compare them question by question:
- 34 went wrong → right, 42 went right → wrong.
- Paired difference: −0.8 ± 1.7 points. The interval includes zero, so there's no significant drop.
- No significant drop doesn't mean no change: someone still needs to read the 42 regressions.
TIP
◆ Pairing helps because the 924 questions both models agree on cancel out. Treated as two separate samples, the difference would carry ±4.0 points, more than twice the paired ±1.7. The same counts give a McNemar test: (42 − 34)² ÷ 76 ≈ 0.84, p ≈ 0.36. And the flip rate is (34 + 42) ÷ 1,000 = 7.6%, nearly ten times the 0.8-point score change.
6. Rung 4: your product
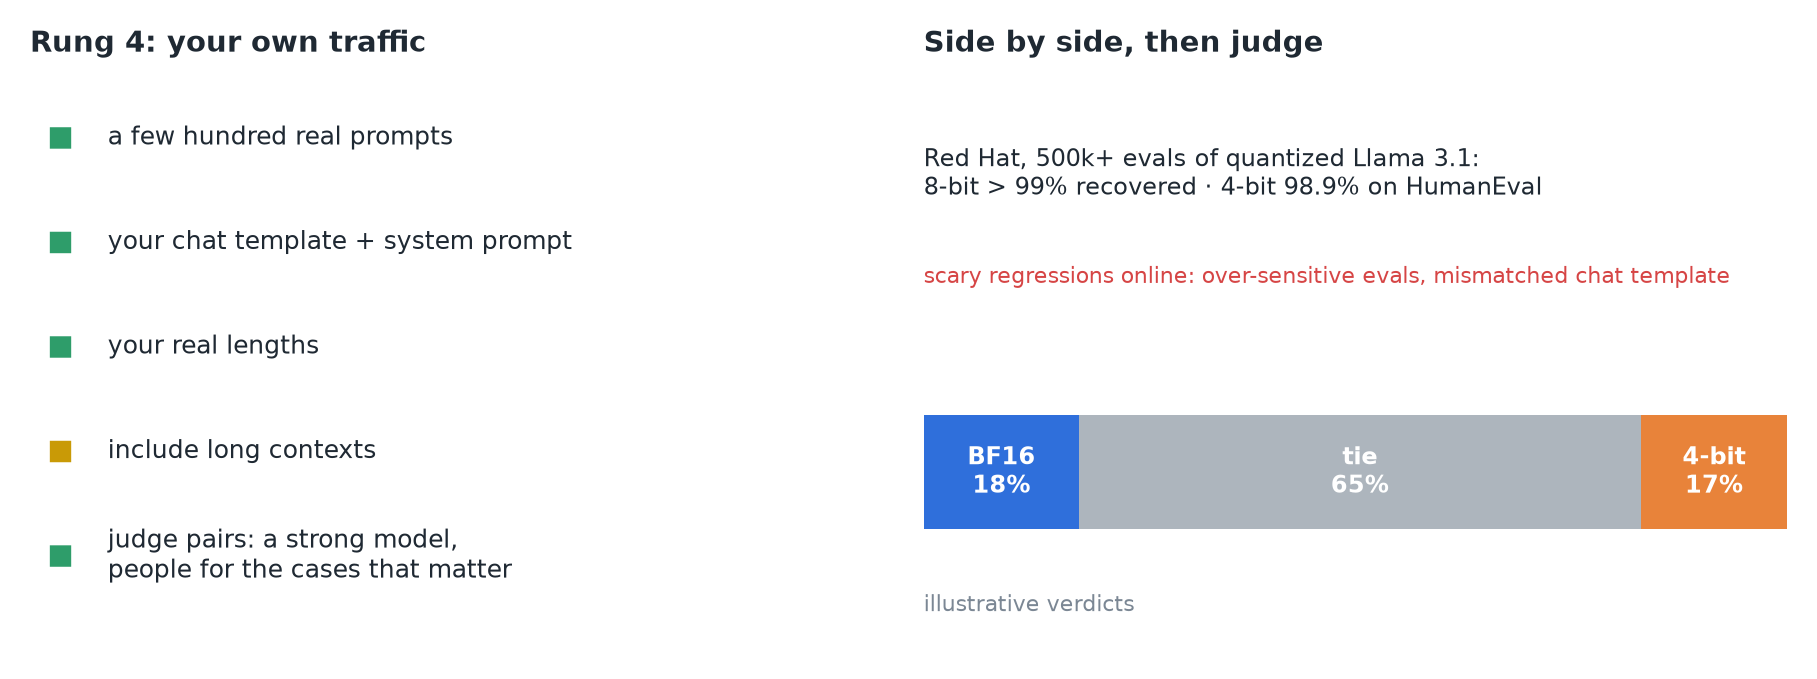 Judge verdicts are illustrative.
- Use a few hundred real prompts, with your chat template, your system prompt and your real lengths. Include long contexts.
- Put the original's answer and the quantized model's answer side by side and have a judge pick: a strong model, plus people for the cases that matter.
- A result like 18% / 65% tie / 17% is a tie.
- Red Hat, 500,000+ evaluations of quantized Llama 3.1 (8B, 70B, 405B): 8-bit recovers > 99%; 4-bit 98.9% on coding (HumanEval).
- Many scary regressions posted online came from over-sensitive evals or a mismatched chat template, not from quantization.
7. Decide
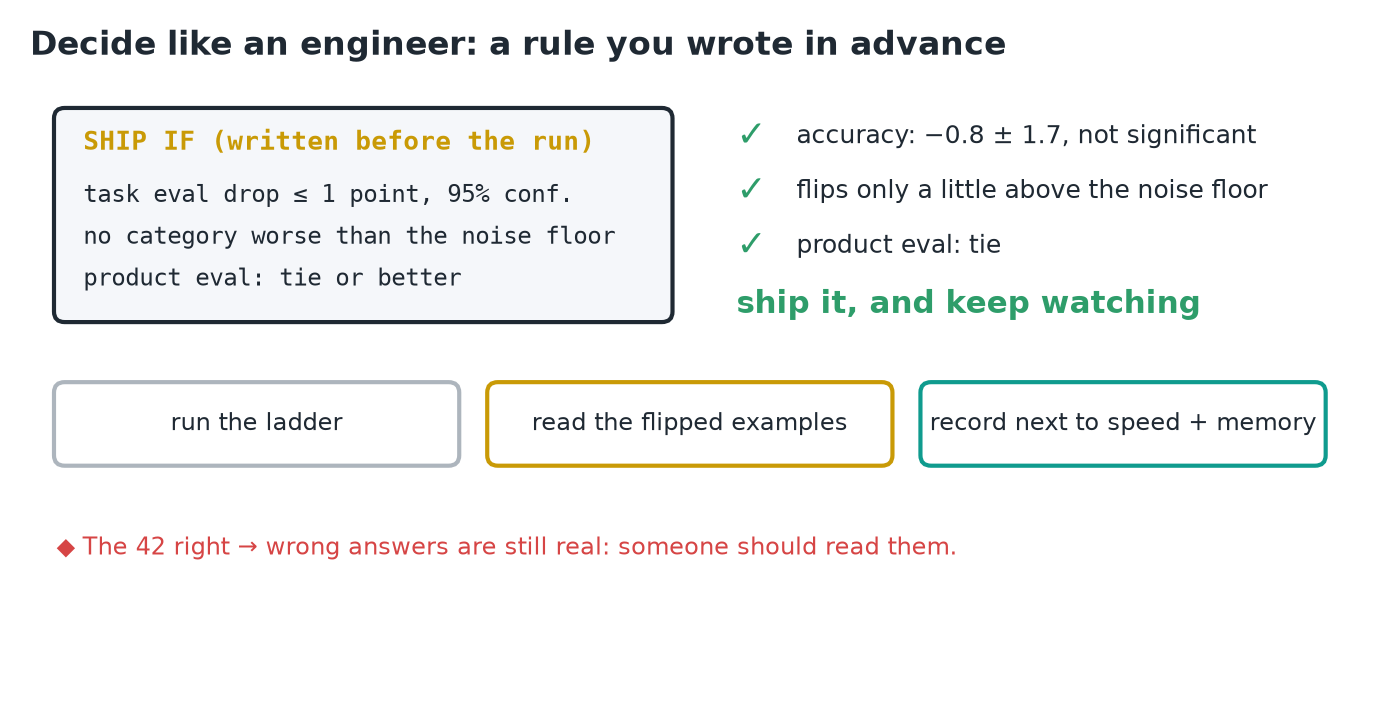 Results are the lesson's illustrative ones.
- Write the rule before the run, for example:
- task eval drop ≤ 1 point at 95% confidence;
- no category worse than the noise floor;
- product eval: tie or better.
- Then run the ladder, read the flipped examples, and record the result next to the speed and memory gains.
- Here: accuracy −0.8 ± 1.7, not significant; flips only a little above the floor; product eval a tie. Ship it, and keep watching.
IMPORTANT
A quality claim needs three things: the noise floor, a paired comparison with error bars, and a check on your own prompts. A single averaged score proves nothing either way.
8. Three quick corrections
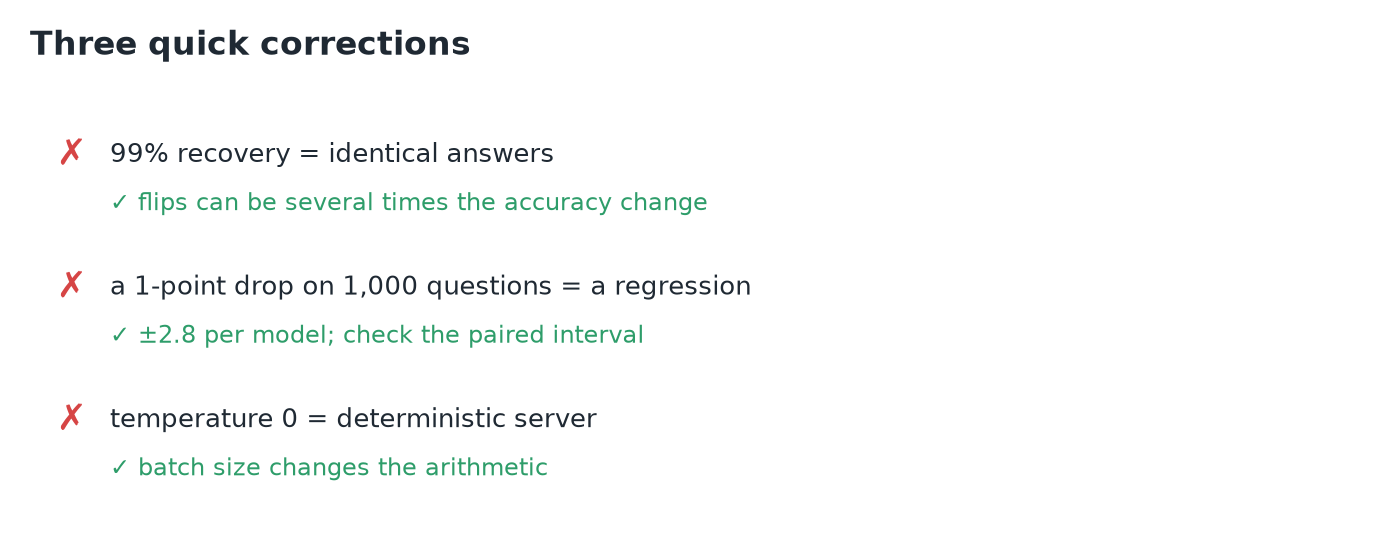
- 99% recovery doesn't mean identical answers: flips can be many times the accuracy change.
- A 1-point drop on 1,000 questions isn't a regression by itself: check the paired interval.
- Temperature 0 doesn't make a server deterministic: batching changes the arithmetic.
9. Recap